How much does model-predictive heating and cooling save over a thermostat on a time-of-use tariff, when the model and forecast are wrong?
research/infra-hvacmpc
Does MPC beat a thermostat for a heat pump on a time-of-use tariff? On real TMY3 weather with a deliberately wrong model and yesterday's weather as the forecast it pays 10.7% less in Greensboro (4.1% in cold Sand Point), saves more with more thermal mass (6.5% to 25%), and loses the gain at an 8 K forecast error; the envelope is from published values, not a fit to measured data.
What it found
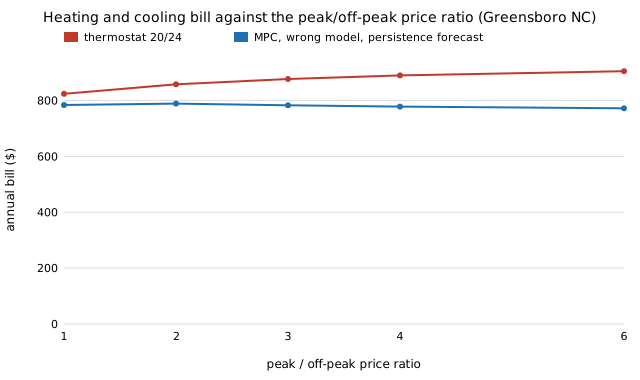
A two-state RC house (ASHRAE 140 Case 600 style envelope, recalled and not checked) with a heat pump (Staffell et al. 2012 COP fit) on NREL TMY3 hourly weather for Greensboro NC and Sand Point AK, a PI thermostat, and a receding-horizon LP controller (HiGHS, 24 h) on an assumed three-band tariff. The controller's model is wrong by a stated amount (true loss +15 to 30%, lighter, sunnier) and its forecast is yesterday's weather. Greensboro: $783 a year against $877 for a 20/24 thermostat (−10.7%), with 2,383 against 7,621 K h outside the 20–24 °C band; a thermostat tuned to 2,839 K h pays $1,300. Flat tariff 4.8%; Sand Point 4.1% and 2.4%. The saving grows with peak/off-peak ratio (4.9% to 14.7%) and thermal mass (6.5% to 25%), and vanishes at 8 K forecast error. Not sourced: heat capacities (swept), cooling COP, solar factor, tariff and 6 kW capacity (assumed); no measured building data was reachable, so nothing is fitted. Simulation only.
A figure from its own output
Paper, code and results
More in Energy supply and dense energy storage
- Does a DC screen find the N-1 outages an AC power flow flags?DC against AC N-1 screening on IEEE 14-, 30-, 39-, 57- and 118-bus cases (every line and transformer outage, modelled, ratings swept): at 25 % rating headroom the DC screen misses 13 to 40 % of the outages an AC power flow calls insecure; flagging at 0.8 of rating misses none, at the cost of 102 false alarms on case118 (186 outages).
- Do nodal loss penalty factors repair the DC OPF's merit order on the IEEE 30-, 39- and 118-bus cases?Nodal loss penalty factors (AC loss sensitivities) in a DC OPF on the IEEE 30-, 39- and 118-bus cases: on the 118-bus case they recover 23 to 38 % of plain DC's excess cost at 0.6 to 1.0 of load, but the iteration does not converge at 0.8 and above and at 1.1 of load the dispatch is worse than plain DC (modelled benchmark, not a measured system).
- Which freight modes can run on batteries or hydrogen, and what does it cost in payload?Freight energy per tonne-km from first principles for truck, unit train, bulk carrier and 747 freighter, then diesel swapped for batteries or hydrogen at the same gross mass and range: at 250 Wh/kg a truck keeps 79% of its payload, a train 93%, a ship 55% and the freighter cannot fly the route; 90% needs ~510, 180, 990 and 5,600 Wh/kg (most inputs assumed and swept).
- How much of a pump-scheduling saving survives when one hot day sets the month's demand charge?Net3 pump schedules billed on PG&E B-19 over a month of varying days: with every day the same the best schedule saves 56 to 67 %, but the lowest feasible peak jumps from 63 kW to the 310 kW booster at only 1.5 % more demand, and one day at +20 % cuts the saving to 44 % (summer) and 19 % (winter, spring) (simulated; one network, list prices).
- Does a real demand charge change when a water utility should run its pumps?Net3 pump scheduling billed on PG&E's published B-19 tariff with demand charges at a 15-minute step: the lake-pump schedules that idle the 310 kW booster cut the monthly bill 56 to 67 % (peak 373 to 63 kW), and the demand charge, 60 to 64 % of the shipped bill, does not move the optimal schedule at any size from 0 to 20 times (simulated; one network, list prices).
- When should a water utility run its lake pump, and how much of the saving is the tariff?Pump scheduling on EPANET's Net3 (WNTR): running the lake pump 21 h from 01:00 cuts pumping energy 52 % at a flat tariff because it idles the booster pump; the time-of-use tariff adds 3 to 16 % of cost at a ratio of 3 or less, and hourly on/off schedules (21,806 simulated, plus a GA) add almost nothing beyond one window once tank drawdown is priced (simulated, assumed tariff shapes).
All 39 Energy supply and dense energy storage projects →
Other research topics
Proper scoring & elicitation28Effort & peer prediction9Verification games & slashing19Detection & tolerances14Markets as routers13Prediction-market design9Paying contributors8Decentralised training systems23Digital twins & sim-to-real164LLM chip design loops40Robot manufacturing loops53Ambient AI assistant46Self-replicating manufacturing34Simulation-first design64Engineered clothing45Task-specific AI accelerators40Algorithmic chip-design loops42Open-source purpose-built robots44The software-engineering loop43Adversarial human imitation41Open-source residential construction41Autonomous multi-angle capture34Sensing, imaging and 3D31Energy supply and dense energy storage39Robot societies among people31Agentic co-design of low-cost robots27Laundry-hanging robots25Machine learning on qualitative data23Robots on the building site27Civilizations & group psychology1History & human sciences1
Produced with AI assistance (Claude). Results are from the code in this repository and are simulated or stylised unless the abstract says otherwise; nothing here implies affiliation with or endorsement by any lab, researcher or company cited. MIT licensed.