Does regulator set-point still beat inverter volt-var for PV hosting on the IEEE 34- and 123-node feeders?
research/infra-hosting-feeders
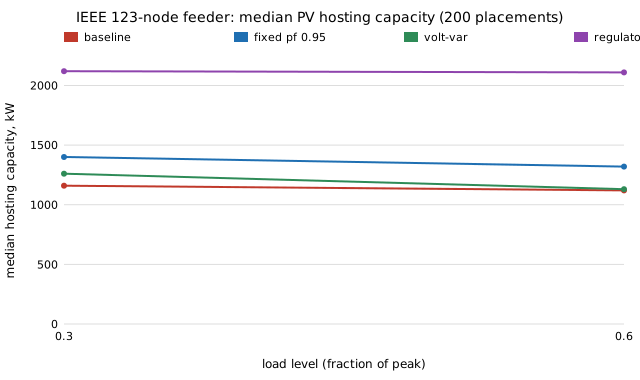
PV hosting capacity of the IEEE 34- and 123-node feeders in OpenDSS (200 random placements): on the 123-node feeder a 2 V lower regulator set-point adds +790 kW to a 1,160 kW median (every placement better), inverter volt-var +100 kW and fixed power factor +180 kW; the published 34-node case has no headroom at all because its source is set to 1.05 pu (modelled, not measured feeders); over a one-minute day the set-point trades overvoltage for undervoltage while inverter reactive power cuts tap operations about 30 %.
What it found
Does the 13-node result of infra-hosting (a lower regulator set-point beats inverter reactive power) survive on larger feeders? The same OpenDSS ramp (PV added at 1–8 random customer loads until the first service voltage above 1.05 pu or transformer above its kVA rating; 200 placements, seed 1, every measure on identical placements) is run on the IEEE 123-node feeder (3,490 kW) and the 34-node feeder (1,769 kW). 123-node, load 0.3 of peak: baseline median 1,160 kW (10th–90th percentile 380–2,440); a 2 V lower set-point on all regulators +790 kW (better on 100 % of placements), fixed power factor 0.95 +180 kW (better 64 %, worse 34 %), the IEEE 1547-2018 Category B volt-var curve +100 kW (64 % / 28 %); the lowest service voltage at peak with no PV stays 0.960 pu at −2 V and falls to 0.940 at −4 V. The ranking holds, but inverter reactive power does help here, unlike on the 13-node feeder. The published 34-node case sets its source to 1.05 pu, so a regulated bus is already above 1.05 with no PV and hosting capacity is 0 for every placement and measure; with the source at 1.00 (an edit) the median is 590 kW and fixed power factor (+180) edges out the set-point (+140). Limits: snapshots, not a day; no conductor ampacities (the cases give none; worst line current at capacity is reported instead); the volt-var curve points are recalled, and the 34-node source edit is mine. Quasi-static day (added): the 123-node feeder run for a day at one-minute steps with the PV and load shapes shipped with the OpenDSS case (40 placements, 2,000 kW of PV, peak-load day): the baseline spends a median 247 min above 1.05 pu and 401 regulator tap operations; a 2 V lower set-point removes the overvoltage (0 min) but adds 193 min below 0.95 pu (baseline 11) and no fewer tap operations (412); fixed power factor 0.95 and volt-var cut overvoltage to 145 and 134 min and tap operations by about 30 % (292, 280) with no undervoltage. So the snapshot ranking reverses once undervoltage is counted. Limits: one PV shape (a cloudy day of unstated origin), regulators settle fully each minute, and some volt-var runs at 3,000 kW did not converge.
A figure from its own output
Paper, code and results
More in Energy supply and dense energy storage
- How much does model-predictive heating and cooling save over a thermostat on a time-of-use tariff, when the model and forecast are wrong?Does MPC beat a thermostat for a heat pump on a time-of-use tariff? On real TMY3 weather with a deliberately wrong model and yesterday's weather as the forecast it pays 10.7% less in Greensboro (4.1% in cold Sand Point), saves more with more thermal mass (6.5% to 25%), and loses the gain at an 8 K forecast error; the envelope is from published values, not a fit to measured data.
- Does a DC screen find the N-1 outages an AC power flow flags?DC against AC N-1 screening on IEEE 14-, 30-, 39-, 57- and 118-bus cases (every line and transformer outage, modelled, ratings swept): at 25 % rating headroom the DC screen misses 13 to 40 % of the outages an AC power flow calls insecure; flagging at 0.8 of rating misses none, at the cost of 102 false alarms on case118 (186 outages).
- Do nodal loss penalty factors repair the DC OPF's merit order on the IEEE 30-, 39- and 118-bus cases?Nodal loss penalty factors (AC loss sensitivities) in a DC OPF on the IEEE 30-, 39- and 118-bus cases: on the 118-bus case they recover 23 to 38 % of plain DC's excess cost at 0.6 to 1.0 of load, but the iteration does not converge at 0.8 and above and at 1.1 of load the dispatch is worse than plain DC (modelled benchmark, not a measured system).
- Which freight modes can run on batteries or hydrogen, and what does it cost in payload?Freight energy per tonne-km from first principles for truck, unit train, bulk carrier and 747 freighter, then diesel swapped for batteries or hydrogen at the same gross mass and range: at 250 Wh/kg a truck keeps 79% of its payload, a train 93%, a ship 55% and the freighter cannot fly the route; 90% needs ~510, 180, 990 and 5,600 Wh/kg (most inputs assumed and swept).
- How much of a pump-scheduling saving survives when one hot day sets the month's demand charge?Net3 pump schedules billed on PG&E B-19 over a month of varying days: with every day the same the best schedule saves 56 to 67 %, but the lowest feasible peak jumps from 63 kW to the 310 kW booster at only 1.5 % more demand, and one day at +20 % cuts the saving to 44 % (summer) and 19 % (winter, spring) (simulated; one network, list prices).
- Does a real demand charge change when a water utility should run its pumps?Net3 pump scheduling billed on PG&E's published B-19 tariff with demand charges at a 15-minute step: the lake-pump schedules that idle the 310 kW booster cut the monthly bill 56 to 67 % (peak 373 to 63 kW), and the demand charge, 60 to 64 % of the shipped bill, does not move the optimal schedule at any size from 0 to 20 times (simulated; one network, list prices).
All 39 Energy supply and dense energy storage projects →
Other research topics
Proper scoring & elicitation28Effort & peer prediction9Verification games & slashing19Detection & tolerances14Markets as routers13Prediction-market design9Paying contributors8Decentralised training systems23Digital twins & sim-to-real164LLM chip design loops40Robot manufacturing loops53Ambient AI assistant46Self-replicating manufacturing34Simulation-first design64Engineered clothing45Task-specific AI accelerators40Algorithmic chip-design loops42Open-source purpose-built robots44The software-engineering loop43Adversarial human imitation41Open-source residential construction41Autonomous multi-angle capture34Sensing, imaging and 3D31Energy supply and dense energy storage39Robot societies among people31Agentic co-design of low-cost robots27Laundry-hanging robots25Machine learning on qualitative data23Robots on the building site27Civilizations & group psychology1History & human sciences1
Produced with AI assistance (Claude). Results are from the code in this repository and are simulated or stylised unless the abstract says otherwise; nothing here implies affiliation with or endorsement by any lab, researcher or company cited. MIT licensed.