How much of a pump-scheduling saving survives when one hot day sets the month's demand charge?
research/infra-pumpdays
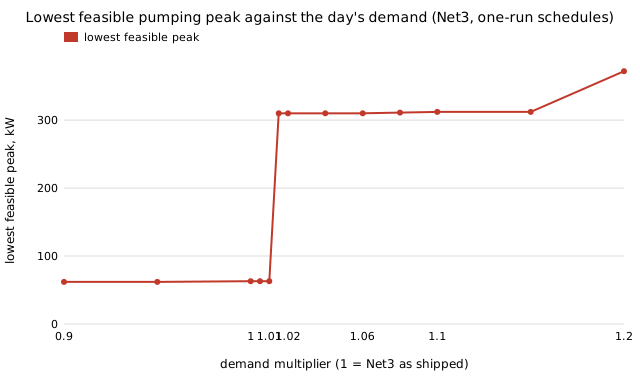
Net3 pump schedules billed on PG&E B-19 over a month of varying days: with every day the same the best schedule saves 56 to 67 %, but the lowest feasible peak jumps from 63 kW to the 310 kW booster at only 1.5 % more demand, and one day at +20 % cuts the saving to 44 % (summer) and 19 % (winter, spring) (simulated; one network, list prices).
What it found
infra-pumpdemand billed Net3 pump schedules on PG&E Schedule B-19 with every day identical and found that schedules idling the 310 kW booster cut the bill 56–67 %. A demand charge is set by the highest 15-minute kW of the month, so this project re-simulates all 21,806 schedules with at most two daily on-runs at a 900 s step on days with every Net3 demand scaled by 0.8, 1.0, 1.2, 1.4 and 1.6, and bills 30-day months of ordinary days plus 1, 3 or 10 hot days. With demand 1.5 % above Net3’s shipped level the lowest feasible peak among one-run schedules (tanks above minimum, 20 psi, tanks back to within 0.1 % of the day’s demand) jumps from 63 kW to 310 kW, the booster; at +20 % it is 372 kW, the same as the shipped schedule. A month with three days at +20 % saves 43.5 % (summer) and 18.7–19.2 % (winter, spring) against the shipped schedule on the same month, against 56, 66 and 67 % with identical days; at +40 % 1at +40 % 3–14 %ndash;15 %; at +60 % no schedule meets the periodic tank test. Choosing a different schedule for the hot days than for ordinary days adds at most 4.2 points (summer; under 1 point in winter and spring) over one schedule feasible on every day. The day multiplier is a sweep, not a measured demand distribution; each day is simulated as periodic (tanks return to where they started), so a hot day cannot borrow from its neighbours; the threshold is for one-run schedules and a 0.1 % tolerance; B-19 is not the tariff a utility of Net3’s size is on, and it is one teaching network.
A figure from its own output
Paper, code and results
More in Energy supply and dense energy storage
- Does a real demand charge change when a water utility should run its pumps?Net3 pump scheduling billed on PG&E's published B-19 tariff with demand charges at a 15-minute step: the lake-pump schedules that idle the 310 kW booster cut the monthly bill 56 to 67 % (peak 373 to 63 kW), and the demand charge, 60 to 64 % of the shipped bill, does not move the optimal schedule at any size from 0 to 20 times (simulated; one network, list prices).
- When should a water utility run its lake pump, and how much of the saving is the tariff?Pump scheduling on EPANET's Net3 (WNTR): running the lake pump 21 h from 01:00 cuts pumping energy 52 % at a flat tariff because it idles the booster pump; the time-of-use tariff adds 3 to 16 % of cost at a ratio of 3 or less, and hourly on/off schedules (21,806 simulated, plus a GA) add almost nothing beyond one window once tank drawdown is priced (simulated, assumed tariff shapes).
- How much heat-pump and EV load growth wears out a distribution transformer, and how much does smart charging buy back?Distribution transformer ageing under heat-pump and EV growth: an IEEE C57.91-form thermal model on TMY weather and a standard load profile; loss of life stays under 0.01%/yr until ~50% of homes electrify, then 5.6%/yr at 100% with uncoordinated charging against 1.07%/yr with valley-filled charging (constants swept, not verified).
- How big should a home's solar array and battery be, and at what installed price does the battery pay?How big should a home's solar array and battery be, and at what price does the battery pay? Hourly model on synthetic weather (assumed inputs): a 6 kW array meets 35% of an 8,000 kWh/yr load, a 10 kWh battery lifts it to 59%, and the battery pays only below about $451/kWh installed at $0.05 export (assumed price $800).
- Does time-of-use pricing make a home battery pay, and which size?Does time-of-use pricing make a home battery pay, and which size? On an assumed tariff with the flat tariff's average, a 10 kWh battery behind 6 kW PV breaks even at $641/kWh installed against $444 flat (assumed price $800); only 2.5 to 5 kWh clears $800, and the peak price steers the answer (
energy-homewith hourly prices). - What is the cheapest mix of solar, wind, gas and storage that cuts a power system's emissions, and what does the last 5% cost?What is the cheapest mix of solar, wind, gas and storage that cuts emissions, and what does the last 5% cost? PyPSA on 2019 German hourly demand (assumed costs): $79/MWh all-gas, $113 at an 80% cut, $177 at zero emissions with 10.6 TWh of hydrogen storage; abatement cost $30/t to $1,765/t for the last 5%. Stylised.
All 39 Energy supply and dense energy storage projects →
Other research topics
Proper scoring & elicitation28Effort & peer prediction9Verification games & slashing19Detection & tolerances14Markets as routers13Prediction-market design9Paying contributors8Decentralised training systems23Digital twins & sim-to-real164LLM chip design loops40Robot manufacturing loops53Ambient AI assistant46Self-replicating manufacturing34Simulation-first design64Engineered clothing45Task-specific AI accelerators40Algorithmic chip-design loops42Open-source purpose-built robots44The software-engineering loop43Adversarial human imitation41Open-source residential construction41Autonomous multi-angle capture34Sensing, imaging and 3D31Energy supply and dense energy storage39Robot societies among people31Agentic co-design of low-cost robots27Laundry-hanging robots25Machine learning on qualitative data23Robots on the building site27Civilizations & group psychology1History & human sciences1
Produced with AI assistance (Claude). Results are from the code in this repository and are simulated or stylised unless the abstract says otherwise; nothing here implies affiliation with or endorsement by any lab, researcher or company cited. MIT licensed.