When should a water utility run its lake pump, and how much of the saving is the tariff?
research/infra-pumpsched
Pump scheduling on EPANET's Net3 (WNTR): running the lake pump 21 h from 01:00 cuts pumping energy 52 % at a flat tariff because it idles the booster pump; the time-of-use tariff adds 3 to 16 % of cost at a ratio of 3 or less, and hourly on/off schedules (21,806 simulated, plus a GA) add almost nothing beyond one window once tank drawdown is priced (simulated, assumed tariff shapes).
What it found
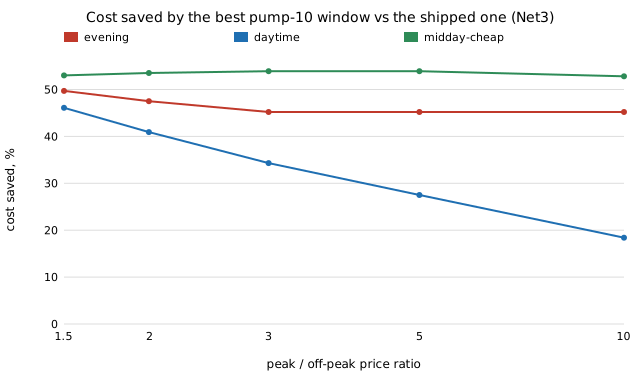
WNTR simulates Net3 for three days with pump 10 (the lake source) on a repeating 24-hour schedule, scoring the last day on pump energy (Net3’s 75 % efficiency) and time-of-use cost under three assumed tariff shapes with the peak/off-peak ratio swept 1.5–10. Feasible schedules keep the tanks in range and the daily balance within 1 %; pressure and tank range never bind. At a flat tariff the best window (01:00, 21 h) uses 1,307 kWh a day against 2,728 as shipped, 52 % less, because Net3’s river supply is mostly gravity and the booster pump 335 only runs when tank 1 is low, so more lake pumping idles it: a saving that needs no tariff. Beyond that, knowing the tariff adds 3.3 % of shipped cost at ratio 1.5, 15.8 % at 3 and 95 % at 10 for a 16:00–21:00 peak, and 3.1/12.1/39.2 % for a daytime peak. An exhaustive search of all 21,806 schedules with at most two on-runs a day finds a second window worth 0–0.02 % of cost for 8 of 10 tariffs (9.5 % and 1.2 % for the other two); a genetic algorithm and a local search over all 224 hourly schedules beat that by up to 4 points, but most of it is tank drawdown within the 1 % tolerance, and priced it falls to about 0–1.3 points. A first version mis-simulated windows that cross midnight; corrected here. One network, assumed tariffs (none sourced), no demand charge, a 1 % mass-balance gap not traced.
A figure from its own output
Paper, code and results
More in Energy supply and dense energy storage
- How much heat-pump and EV load growth wears out a distribution transformer, and how much does smart charging buy back?Distribution transformer ageing under heat-pump and EV growth: an IEEE C57.91-form thermal model on TMY weather and a standard load profile; loss of life stays under 0.01%/yr until ~50% of homes electrify, then 5.6%/yr at 100% with uncoordinated charging against 1.07%/yr with valley-filled charging (constants swept, not verified).
- How big should a home's solar array and battery be, and at what installed price does the battery pay?How big should a home's solar array and battery be, and at what price does the battery pay? Hourly model on synthetic weather (assumed inputs): a 6 kW array meets 35% of an 8,000 kWh/yr load, a 10 kWh battery lifts it to 59%, and the battery pays only below about $451/kWh installed at $0.05 export (assumed price $800).
- Does time-of-use pricing make a home battery pay, and which size?Does time-of-use pricing make a home battery pay, and which size? On an assumed tariff with the flat tariff's average, a 10 kWh battery behind 6 kW PV breaks even at $641/kWh installed against $444 flat (assumed price $800); only 2.5 to 5 kWh clears $800, and the peak price steers the answer (
energy-homewith hourly prices). - What is the cheapest mix of solar, wind, gas and storage that cuts a power system's emissions, and what does the last 5% cost?What is the cheapest mix of solar, wind, gas and storage that cuts emissions, and what does the last 5% cost? PyPSA on 2019 German hourly demand (assumed costs): $79/MWh all-gas, $113 at an 80% cut, $177 at zero emissions with 10.6 TWh of hydrogen storage; abatement cost $30/t to $1,765/t for the last 5%. Stylised.
- How much energy can each storage technology hold per kilogram, at the most?How much energy can each storage technology hold per kilogram, at the most? First-principles ceilings that reproduce five published values within 0.3% (Li-S 2,567, Li-O2 3,458 Wh/kg). No battery couple exceeds 1.65 eV per reactant atom, so light atoms set the winners (Wh/kg = 26,801 × eV/atom ÷ g/mol); flywheels top out near 0.3 eV/atom, heat and pumped hydro far lower. Active material only. First project of track 16.
- How much energy can each storage chemistry hold per litre, and does the ranking by weight survive?How much energy can each storage chemistry hold per litre, and does the ranking by weight survive? Volumetric ceilings from reactant densities: zinc-air 9,659 Wh/L with air, Li-ion 1,382, lead-acid 724, hydrogen 1,314 at 700 bar.
All 39 Energy supply and dense energy storage projects →
Other research topics
Proper scoring & elicitation28Effort & peer prediction9Verification games & slashing19Detection & tolerances14Markets as routers13Prediction-market design9Paying contributors8Decentralised training systems23Digital twins & sim-to-real164LLM chip design loops40Robot manufacturing loops53Ambient AI assistant46Self-replicating manufacturing34Simulation-first design64Engineered clothing45Task-specific AI accelerators40Algorithmic chip-design loops42Open-source purpose-built robots44The software-engineering loop43Adversarial human imitation41Open-source residential construction41Autonomous multi-angle capture34Sensing, imaging and 3D31Energy supply and dense energy storage39Robot societies among people31Agentic co-design of low-cost robots27Laundry-hanging robots25Machine learning on qualitative data23Robots on the building site27Civilizations & group psychology1History & human sciences1
Produced with AI assistance (Claude). Results are from the code in this repository and are simulated or stylised unless the abstract says otherwise; nothing here implies affiliation with or endorsement by any lab, researcher or company cited. MIT licensed.