Which open hydraulic circuit gets a small excavator closest to stock energy use for the least money?
research/heavy-hydraulics
Research programme (proposal stage): pump-shaft energy of fixed open-centre, load-sensing and ideal independent-metering circuits on an illustrative excavator cycle; over 2,916 swept cases load-sensing uses a median 47% of open-centre energy and metering 80% of load-sensing, an ordering that holds by construction; on 20,000 random cycles in a machine envelope load-sensing is a median 44% of open-centre; no measured cycle, margin or price is sourced yet
13 tests
What it found
An open research programme on which hydraulic circuit a small shop can build from catalogue parts to get a 1.5 to 3 t excavator closest to stock energy use, and at what parts cost. Milestone 1 is a stdlib model of pump-shaft energy for three circuits (fixed-displacement open-centre, load-sensing, ideal independent metering; analytic single-actuator check, 6 tests) and a 2,916-case grid on one four-phase cycle: load-sensing uses a median 47% of open-centre shaft energy (22 to 81%), saving more as flow demand falls (31%, 47%, 63% of open-centre at 0.5, 0.75 and 1.0 of full flow), and metering uses a median 80% of load-sensing, 88% with equal actuator pressures and 74% at 1.5 times the reference spread. The ordering holds in every case but only because each rung removes a loss term, so it is a code check rather than a finding. The cycle, pressures, flows and margins are illustrative values written from memory and swept, not sourced; there are no dynamics, leakage, line losses, energy recovery or parts costs; the DOI registry was unreachable so references were checked by web search, not cite_check. Milestone 2a repeats the comparison on 20,000 random cycles inside a machine envelope (pump 45 L/min, 20 to 180 bar, taken from an unopened search summary of one mini-excavator listing): load-sensing uses a median 44% of open-centre energy, metering 72% of load-sensing (87% at equal actuator pressures), and H3 fails per case in about a third of equal-pressure cycles. The cycles are random, not measured. Preliminary; arithmetic only, nothing run on a machine.
A figure from its own output
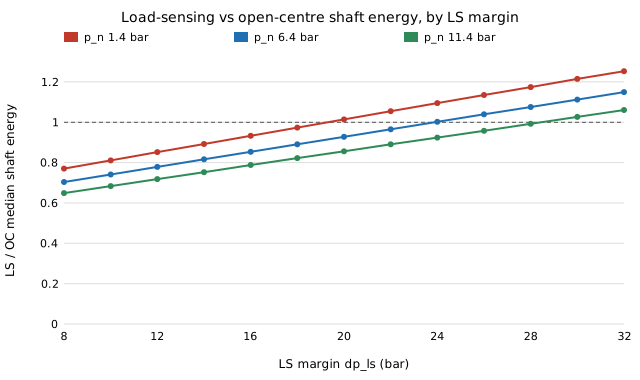
heavy-hydraulics/experiments/ranking_map.svg, written by the project's own experiment code.
Research log
Ongoing: each run adds a batch and an entry, newest first. Source: LOG.md.
2026-11-01 · Milestone 3m: what does the larger pump cost in energy, and where does the break-even dp_ls go? (prediction registered before running)
Why: 3k's "Next" (a sibling run's 3l priced the same pump in fuel and parts). A pump 20% above peak demand removes open-centre's median time penalty, but in this model open-centre draws full pump flow at the highest load pressure in every phase, so a bigger pump should cost shaft energy. experiments/pump_size_energy.py reruns 3i (rated-sizing spools at 1.0 x rated, load factor 0.346, LS standby 2 L/min, open-centre charged full pump power for stretched seconds) with the open-centre pump scaled 1.0, 1.1, 1.2 and 1.5 x and the neutral drop read from the PVG 32 curve at the scaled flow; load-sensing is unchanged. Break-even dp_ls = the LS margin at which median LS/OC = 1.
Prediction (before running): break-even dp_ls rises monotonically with pump size (more open-centre energy), so it is above 3i's 36.1 bar at 1.2 x. Prior 80%. Refuted if the 1.2 x break-even is at or below 36.1 bar.
Limits that carry over: demands from the assumed force model; work-port-to-tank drop as rating point; no compensator; parts cost of the larger pump not priced here.
### Outcome of 3m (experiments/pump_size_energy_results.txt, seeded, 1,500 cycles per cell, 23 s)
Break-even dp_ls (median LS/OC = 1): 36.1 bar at 1.0 x (reproduces 3i), 40.0 at 1.1 x, 44.5 at 1.2 x, and no crossing up to 60 bar at 1.5 x (LS/OC 0.62 at 26 bar). Median open-centre time penalty 6.25%, 0.93%, 0.00%, 0.00%. Prediction held: monotone rise, 44.5 > 36.1.
Reading: removing open-centre's starvation penalty with a bigger pump is not free in energy. Against the no-time-penalty break-even of 28.0 bar (2n/3f), the 6.25% penalty at a pump sized to demand raised it to 36.1 bar (open-centre burns extra seconds at full pump power); a 20% larger pump removes that penalty but its extra flow raises the break-even again, to 44.5 bar, so in energy terms the oversized pump is worse for open-centre than the starved one. A load-sensing margin of 14 to 30 bar beats open-centre on shaft energy at every pump size tested, by more as the pump grows. This does not price the extra pump or the productivity lost to starvation.
Limits: open-centre is modelled as full pump flow at the highest load pressure (the pessimistic end, 2a), which is what makes a bigger pump cost energy; a real open-centre pump with a flow-sharing or unloading valve would not. Not a measurement.
Next: the compensator; price the pump rungs against the parts cost of milestone 4.
2026-11-01 · Milestone 3l: what does the larger pump cost in fuel and parts against the time it saves? (prediction registered before running)
Why: 3k's "Next". The open-centre time penalty vanishes with a pump 1.2 x the peak demand, but a larger fixed pump moves more neutral flow through the valve during idle (flow x p_n, 2i to 2n) and costs more. experiments/pump_cost.py reruns 3k's cycles at 0.8, 1.0, 1.2 and 1.5 x pump with the energy of cycle_energy on the stretched cycle plus the idle neutral flow at Q x p_n (p_n from pvg_neutral, load factor 0.346 as in 3i), then reports per scale: energy per cycle, cycle time (stretched work plus idle), and the implied break-even value of a machine hour, ((extra fuel + pump premium amortised over 2,000 h) per hour) / (hours saved per working hour). Pump price scales linearly with flow from the one listed gear-pump price in payback.py (ASSUMED, swept to 3 x that slope); diesel $6.28/gal as in payback.py.
Prediction (before running): open-centre shaft energy per cycle rises with pump size by under 5% from 1.0 x to 1.2 x and under 15% from 1.0 x to 1.5 x, and the break-even machine-hour value at 1.2 x is below $50 per hour. Prior 50%. Refuted if either energy rise is above its bound or the break-even value is above $50/h.
### Outcome of 3l (experiments/pump_cost_results.txt, seeded, 1,500 cycles per row)
Mean open-centre shaft energy per cycle (idle neutral flow included): 88.0 kJ at 1.0 x, +14.1% at 1.2 x, +34.8% at 1.5 x; mean cycle time -2.55% and -4.70%. The prediction is refuted on energy (I bounded the 1.0-to-1.2 rise at 5% and 1.0-to-1.5 at 15%). The second half held: the break-even value of a machine hour is $7.67 (1.2 x) and $10.27 (1.5 x) with pump price proportional to flow, $8.82 and $11.84 at three times that slope, far under the $50 bound.
Reading: the energy rise is large because the fixed-pump model charges the whole pump flow at load pressure in every work phase, so a 20% larger pump burns about 20% more hydraulic power while moving, not only in neutral. Even so the fuel is cheap against a machine hour, so a 1.2 x pump pays whenever an hour of the machine is worth more than about $9. The pump premium is negligible beside the fuel (0.015 to 0.044 $/h).
0.8 x is not reported as a result: 1,357 of 1,500 cycles have a phase demanding more than the pump delivers and are dropped by cycle_energy (3k handled this with the pump-limit factor), so its row is for 143 unrepresentative cycles.
Limits: the pump price is one retail listing scaled linearly (assumed); idle time is fixed from the unstretched cycle, so saved time is counted as hours saved, not idle energy; OC energy model has no relief or flow-compensated pump; diesel price from a secondary summary; load-sensing is not re-sized (it needs no larger pump in 3k).
Next: the same break-even against a load-sensing pump (the real alternative to oversizing); add the compensator.
2026-11-01 · Milestone 3k: does the open-centre time penalty depend on how big the pump is? (prediction registered before running)
Why: 3a to 3j fixed the pump at pc.Q_PUMP (45 L/min). The starvation that costs open-centre its time comes from the pump flow being shared by spool openings, so the pump size should matter, and a reader sizing a machine picks it. experiments/pump_size.py reruns 3h/3i's rated-sizing slowdown (smallest covering PVG 32 spool, rated drop read at 1.0 x rated, data/pvg32_dp_at_rated.csv) on the same random cycles with the pump flow scaled to 0.8, 1.0, 1.2 and 1.5 times, demands unchanged, and charges load-sensing its own pump-limit factor max(1, sum q / Q) (3c). Net penalty = open-centre cycle time over load-sensing cycle time.
Prediction (before running): the net open-centre penalty is non-increasing in pump size (median at 1.5 x no higher than at 1.0 x, which reproduces 3h's 6.25% before the LS floor), and at 0.8 x it exceeds 6.25% only because the pump limit binds both circuits, so the net penalty at 0.8 x is smaller than the gross one. Prior 60%. Refuted if the net median at 1.5 x is above that at 1.0 x.
Limits that carry over: demands from the assumed force model; work-port-to-tank drop as rating point; no compensator.
### Outcome of 3k (experiments/pump_size_results.txt, seeded, 1,500 cycles per row)
Net open-centre penalty over load-sensing, median (p95): 17.51% (21.62%) at 0.8 x pump, 6.25% (21.62%) at 1.0 x, 0.00% (21.62%) at 1.2 x, 0.00% (10.68%) at 1.5 x. Gross open-centre penalty at 0.8 x is 22.27%, load-sensing's own pump-limit penalty there 3.80%. Both parts of the prediction held.
Reading: the median penalty vanishes with a pump 20% larger than the peak demand needs, so 3h's 6.25% is a statement about a pump sized at the demand, not about open-centre as such; the tail (p95 21.6%) needs 1.5 x to fall. This is a cost, not a free fix: a larger pump costs more and carries more idle and neutral flow, which this step does not price.
Next: price the larger pump (parts cost from milestone 4, neutral flow from 2i to 2n) against the time saved; add the compensator.
2026-10-31 · Milestone 3j: the manual's P-to-A flow curves pin the rating-point drop (not pre-registered)
Why: 3h and 3i used the work-port-to-tank drop (p. 99) as the rating point and said the P-to-A flow curve was the missing check. The same Danfoss PVG 32 manual (BC152886483664en-001601, July 2024) plots flow against spool travel at 10 bar margin (p. 95) and 20 bar margin (p. 96), uncompensated, P to A. experiments/digitise_pvg_flow.py reads each spool's shaded band at full travel from a 300 dpi render (experiments/data/pvg32_flow_full_travel.csv); experiments/pvg_flow_rating.py turns it into an implied rating drop.
Honesty note: I looked at the plots and ran a rough read before writing this entry, so no prediction is registered.
Result (experiments/pvg_flow_rating_results.txt): full-travel flow at 10 bar is 1.14 times rated (median; 0.84 to 1.23), so with an orifice law the rating applies at a P-to-A drop of 7.3 bar (median, spools A to E; 6.6 to 8.2), the same median as 3h's 7.3 bar from p. 99 (per spool they differ by up to 5 bar: 11.8 against 7.3 for A, 5.3 against 8.2 for C). Median exponent between the two margins 0.53 (orifice 0.50); spool scatter 0.38 to 0.96.
Reading: two independent figures give the same median rating drop, which removes 3h's main caveat about which drop the rating refers to, and puts the 3i sizing in the middle of the 0.8 to 1.2 times rated band (6.25% median time penalty, break-even 36.1 bar) instead of leaving it as one reading of three.
Limits: the figure is "theoretical performance" and plots a band across first to eighth section, I use the band middle; the margin is the pump margin, not necessarily the drop across the P-to-A path alone; spool AA (5 L/min, read error about a third of its flow) is excluded from the A to E medians; the exponent scatter shows the curves are not one orifice law per spool.
Next: use the P-to-A curve's spool-travel axis (not only full travel) for feathering; add the compensator.
2026-10-31 · Milestone 6c: paper section 3.5 gains 3i (a writing step, no experiment)
Added the manual-curve sizing result (6.25% median penalty, break-even 36.1 bar, 34.0 to 38.9 across the rating-point reading) to section 3.5; 5 new rows in paper/check_numbers.py, all matching time_penalised_rated_results.txt (37 claims, 0 missing).
Next: the manual's P-to-A flow curve; the compensator.
2026-10-31 · Milestone 3i: 3f's break-even with the manual-curve sizing (prediction registered before running)
Why: 3h's "Next". experiments/time_penalised_rated.py is 3f with each phase stretched by the rated-sizing slowdown of 3h (spool size and drop at 1.0 x rated from data/pvg32_dp_at_rated.csv; 0.8 and 1.2 x rated as sensitivity) instead of the closing-law factor. Same cycles, same upper-bound charge (open-centre pump at full power for the extra seconds), load factor 0.346, standby 2 L/min.
Prediction (before running): the break-even dp_ls at 1.0 x rated lies between 30 and 38 bar (3f's no-penalty value is 28.0 and its k = 1 value 35.8; 3h's 6.25% median penalty is milder than k = 1's 21.6%). Prior 65%. Refuted if it is below 29 or above 38 bar.
### Outcome of 3i (experiments/time_penalised_rated_results.txt, 10 s, seeded)
Break-even dp_ls (bar): 28.0 (no penalty, reproduces 2n), 36.1 (rated sizing at 1.0 x rated, median time penalty 6.25%), 38.9 (0.8 x rated, 16.81%), 34.0 (1.2 x rated, 2.64%). Prediction held (30 to 38 bar).
LS/OC at the Rexroth 14 bar margin: 0.757 without penalty, 0.663 with it (0.642 to 0.682 across the +-20% rating-point reading); at 26 bar 0.965 falls to 0.846. So at the thesis 25 bar margin load-sensing already wins once slowness is charged, where 2n had it losing.
Reading: charged in energy, the 3h penalty moves the break-even from 28 to 34 to 39 bar, so 2n's ranking at the sourced 14 bar margin stands and strengthens. 3f's "credible range 28 to 29.5" came from a closing law the manual contradicts; with the manual's own spool curves the range is 34 to 39 bar.
Limits: the charge is an upper bound (full pump power during the stretch); the 3h caveat (work-port-to-tank drop used as the rating point) carries over; no compensator or feathering; one load factor.
Next: find the manual's P-to-A flow curve; add the compensator; fold 3i into the paper's section 3.5 and check_numbers.py.
2026-10-31 · Milestone 3h: 3g with the drop at rated flow read from the manual's own curves (prediction registered before running)
Why: 3g swept dp_ref (5 to 35 bar) because the rated drop was not in the pages read. The same manual (BC152886483664en-001601, July 2024, p. 99, "Pressure drop at maximum spool travel position, A/B to T", opened this session) plots drop against flow for each spool. experiments/digitise_pvg_dp.py picks each curve's pixels by colour from a 300 dpi render and reads the drop at 0.8, 1.0 and 1.2 times rated flow (experiments/data/pvg32_dp_at_rated.csv); experiments/rated_sizing_curve.py sizes each spool by its own value.
Read values at rated flow (bar): A 11.8, B 6.7, C 5.3, D 7.3, E 7.6. Caveat that matters: the figure is the work-port-to-tank drop at maximum travel, not the P-to-A drop the flow rating may refer to; I use it as the best available measure of each spool's size, not as proof of the rating point. Read error about 1 bar.
Prediction (before running): the values sit in 5 to 12 bar, the band where 3g's penalty fell from 15.8% (5 bar) to 0.9% (10 bar), so I predict a median time penalty between 1% and 8% and a dig-phase stall-bound share between 10% and 40%.
### Outcome of 3h (experiments/rated_sizing_curve_results.txt, 2 s, seeded)
dp at 1.0 x rated: median time penalty 6.25% (p95 21.6%), dig-phase stall-bound share 35.5%. Both inside the predicted bands (1 to 8%, 10 to 40%).
Sensitivity to the flow at which the rating is read: 0.8 x rated gives 16.8% / 47.5%; 1.2 x rated gives 2.6% / 25.4%. So the penalty is 2.6 to 16.8% across a +-20% reading of the rating point.
Reading: 3g's comfortable case (dp_ref of 14 bar or more, zero penalty) is not what the manual's curves show: they give 5 to 12 bar, so with real discrete spools open-centre sections starve light actuators in a third of multi-actuator dig phases. 3f's time-penalised break-even (28 to 29.5 bar, no k) is therefore an under-statement of load-sensing's advantage if the penalty is charged as energy; it has not been rerun with this sizing.
Limits: the figure is the work-port-to-tank drop, not necessarily the rating point; read error about 1 bar; no compensator or feathering; demands from the assumed force model; sizing rule (smallest covering spool) is mine.
Next: rerun 3f's break-even with this sizing; find the manual's P-to-A flow curve; add the compensator.
2026-10-31 · Milestone 3g: size open-centre sections from the PVG 32 rated flows (not pre-registered)
Why: 3b to 3f needed a closing-law constant k. The PVG 32 manual (Danfoss BC152886483664en-001602, July 2024, pp. 100 to 101, opened this session at assets.danfoss.com/documents/406946/) gives spool sizes A 10, B 25, C 40, D 65, E 100 L/min, and 3d showed the bypass shuts inside the dead band. experiments/rated_sizing.py gives each actuator the smallest spool covering its demand, area = Q_rated / sqrt(dp_ref), bypass closed. I ran it once before writing a prediction, so none is registered.
The drop dp_ref at which the rating applies is not in the pages I read, so it is swept (5, 10, 14, 25, 35 bar). Same random cycles as 3a to 3f.
Reading: with real spool sizes the conclusion of 3d/3f holds for dp_ref of 14 bar or more (median 0, small tail), so 2n's energy ranking needs no large time penalty. It fails if the rated drop is as low as 5 to 10 bar, where discrete spool sizes starve light actuators. The result hinges on dp_ref, which still needs the manual's flow-curve axis (not read).
Limits: sizing rule is mine (smallest covering spool); no compensator or feathering; demands are from the assumed force model.
Next: read dp_ref from the flow-versus-stroke figures, then the compensator.
2026-10-31 · Milestone 6b: the paper draft gains the cycle-time section (a writing step, no experiment)
Why: the draft (milestone 6) stopped at energy and listed "no cycle-time effects" as a threat, while 3a to 3f had priced them. Added section 3.5 (flow-sharing penalty by closing law k, LS pump-limit penalty, time-penalised break-even from 28.0 to 35.8 bar) and reworded threat 6. No number is new; each is copied from flow_share_shape_results.txt, flow_share_ls_results.txt or time_penalised_results.txt, and 10 new rows in paper/check_numbers.py hold them (32 claims, 0 missing).
k of 20 or more is left out of the text as outside the model's validity (3e).
Next: size sections from the PVG 32 rated flows (removes k), then the compensator.
2026-10-30 · Milestone 3f: does the open-centre time penalty move 2n's load-sensing break-even? (not pre-registered)
Why: 2n ranked on energy alone and 3a to 3e priced the time penalty separately. experiments/time_penalised.py stretches each open-centre phase by phase_slowdown (k = 1 to 10, p_n 10.91 bar) and charges the open-centre pump full power for the extra seconds, an upper bound on the energy cost of slowness. Load-sensing is charged nothing extra (3c). Load factor 0.346, standby 2 L/min, 1,500 cycles per cell.
Honesty note: I ran the script once before writing a prediction here, so no prediction is registered for this step. What I would have predicted was "break-even stays at 28 bar for k >= 3 where 3d's penalty is zero".
### Outcome of 3f (experiments/time_penalised_results.txt, 26 s, seeded)
Break-even dp_ls (bar): 28.0 (no penalty, reproduces 2n), 35.8 (k 1), 31.1 (k 1.5), 29.4 (k 2), 28.3 (k 3), 28.0 (k 5), 29.5 (k 10). At the Rexroth 14 bar margin LS/OC is 0.67 to 0.76 for every k; the thesis 25 bar margin favours LS at k <= 2 and k = 10 too.
The "28.0 for k >= 3" guess held at k = 3 and 5 but k = 10 is not monotone: the median time penalty is 0 yet the break-even moves 1.5 bar, because the p95 tail (6.7% in 3d) is enough to change the cycle-mean energy ratio. Read k = 10 with 3e's validity limit in mind.
Reading: charging slowness in energy can only help load-sensing, and it widens the margin by 0 to 8 bar depending on how fast the bypass closes. 2n's ranking at both sourced margins therefore stands, and gets stronger if the bypass closes slowly. The 35.8 bar is for the k the PVG 32 manual contradicts (3d), so the credible range is 28 to 29.5.
Limits: the stretch charge is an upper bound (full pump power); no feathering; one load factor; k a one-number family.
Next: size sections from the PVG 32 rated flows A to E (removes k), then the compensator.
2026-10-30 · Milestone 3e: was 3d's k = 20 row only a bracket bug? (planned before running)
Why: 3d put the bad k = 20 row at 10.9 bar down to section_area bracketing the supply pressure at p_i + 400 bar. Fixed the bracket (it now grows until the sign changes; 1 new test) and reran experiments/flow_share_shape.py with k up to 50.
Prediction (before running): after the fix the median penalty is 0% for k = 20 at p_n 10.9 bar (prior 60%). Refuted if it is above 1%.
### Outcome of 3e (experiments/flow_share_shape_results.txt, 5 s, seeded)
k <= 10 rows are unchanged to two decimals (the old bracket only failed above that). Prediction refuted: at p_n 10.9 bar k = 20 gives a median penalty of 17.1% (stall share 35.9%) and k = 50 gives 21.6% (100%); at p_n 1.44 bar k = 50 gives 11.8%.
Reading: the remaining rise is not a solver bug. With k this large each section is sized for a supply pressure above the 250 bar relief setting (its area is about 0.6 to 1.3, against 2 to 12 at k = 1), so with all sections open the pump flow cannot pass below relief and the lighter actuators are starved. That is a model-validity limit: the sizing rule "passes its demand alone at the supply pressure the closing law implies" stops describing a real valve when that pressure exceeds relief. So 3d's usable range is k up to about 10 at 10.9 bar and up to about 20 at 1.44 bar; the conclusion that a bypass closing inside the dead band (k >= 3 to 5) makes the open-centre time penalty small stands for k in range, and rows beyond are outside the model.
Limits: validity range read off the results, not enforced in code; sizing by rated flows A to E from the manual (3d "Next") would remove the issue and is still not done.
Next: size sections from the PVG 32 rated flows, add the compensator and feathering, then the time-penalised energy ranking.
2026-10-30 · Milestone 3d: what does the PVG 32 manual say about how fast the bypass closes? (planned before running)
Why: 3b's "Next" was to fit k from a bypass-versus-stroke curve. Opened this session (assets.danfoss.com now resolves): Danfoss PVG 32 Technical Information BC152886483664en-001601, July 2024 (the 2n source was the May 2021 revision), p. 95: "In total neutral position the connection to tank is less than 10 % of the full flow function. But when moving the spool out of neutral position but still within dead band area the connection will close." The same page's flow-versus-stroke curves show zero work-port flow for roughly the first 1.5 to 2 mm of a 7 mm stroke. The manual has no bypass-area-versus-stroke curve, so k cannot be fitted; it gives a bound: the bypass is shut before any section opens, which in 3a's terms is a large k.
Plan: add k = 5, 10, 20 to experiments/flow_share_shape.py (same cycles as 3b).
Prediction (before running): at p_n 10.9 bar the median penalty is 0% and the dig-phase stall share is under 2% for k >= 3 (prior 75%). Refuted if the median is above 1% at k = 5 or 10.
### Outcome of 3d (experiments/flow_share_shape_results.txt, 5 s, seeded)
p_n 10.9 bar: median penalty 0.00% for k = 1.5 to 10; p95 0.07% (k 5), 6.69% (k 10); stall share 0.0% for k >= 3. Prediction held for k = 5 and 10.
p_n 1.44 bar: median 0% from k = 5, p95 21.6% (k 5), 1.68% (k 10), 0.00% (k 20).
k = 20 at p_n 10.9 is a solver artefact, not physics: median 8.66%, non-monotone. section_area brackets the supply pressure at p_i + 400 bar, above the 250 bar relief; with a huge k the sizing root lies outside it. Do not read k > 10 rows at 10.9 bar.
Reading: if the bypass closes inside the dead band, as the manual states, 3a's open-centre cycle-time penalty is small for the PVG 32 neutral drop (median 0, p95 under 7%), and 3a's "6.4%" was a product of k = 1, a closing law the manual contradicts. At the 1.44 bar catalogue-valve drop the penalty survives to k of about 3 to 5. So the cost of open-centre in time is not established; the energy ranking of 2n stands without a time penalty for this valve.
Limits: "closes in the dead band" is a qualitative statement read from a manual page, not a curve; k is still a one-number family; the factor-2 stall bound and the sizing-alone assumption remain; the section-sizing solver needs a wider bracket before k > 10 is usable (not fixed here).
Next: fix the bracket (or size sections by the manual's rated flows A to E), add the compensator and feathering, then a time-penalised energy ranking.
2026-10-30 · Milestone 3c: how much of 3a's penalty is open-centre, and how much is just the pump limit? (planned before running)
Why: 3a and 3b set load-sensing's cycle-time factor to 1.0 by construction. But a compensated valve also slows when the actuators' demands add to more than the 45 L/min pump flow. experiments/flow_share_ls.py charges LS max(1, sum q / Q_pump) per phase, floors open-centre at that, and reports open-centre cycle time over load-sensing cycle time. The PVG 32 bypass-versus-stroke data for fitting k is not reachable this session (Danfoss document URLs return 404/403), so k stays 1.
Prediction (before running): load-sensing's own median penalty is under 1% (most demands fit in the pump flow), and the net open-centre median at p_n 10.9 bar is within 1 point of 3a's 6.4% (prior 65%). Refuted if the LS median is 1% or more, or the net median differs from 6.4% by more than 1 point.
### Outcome of 3c (experiments/flow_share_ls.py, flow_share_ls_results.txt, 2 s, seeded; 1 new test)
Load-sensing's own pump-limit penalty is 0.00% (median and 95th percentile) at both neutral drops; across 5 x 300 sampled cycles no phase's summed demand exceeds the 45 L/min pump, so no phase was floored. Net open-centre over load-sensing: p_n 10.9 bar median 5.80%, p95 21.62%; p_n 1.44 bar median 21.62%. Prediction held (LS median under 1%; 5.80% is within 1 point of 3a's 6.4%; the 5.80 is 3b's k = 1 row, 300 cycles per seed instead of 1,000).
Reading: 3a's "one-sided comparison" caveat is closed for the sampled cycles: the penalty is entirely the uncompensated open-centre valve's flow sharing, none of it a pump limit both circuits share. This holds only for the duty-cycle generator's demands (2d); a larger excavator task could exceed the pump.
Limits: unchanged from 3a/3b (k = 1, factor-2 stall bound, no feathering, no dynamics). k still needs the PVG 32 bypass-versus-stroke curve, not reachable this session.
2026-10-30 · Milestone 3b: is 3a's cycle-time penalty an artefact of the bypass closing law? (planned before running)
Why: 3a listed "one bypass shape (area closes linearly with section area)" as a limit. flow_share.py now takes k, the bypass area closed per unit of section area (k = 1 is 3a); experiments/flow_share_shape.py sweeps k = 0.5, 1, 1.5, 2, 3 at both sourced neutral drops, 5 seeds x 300 cycles (3a used 1,000 per seed, so the k = 1 row differs slightly from 3a).
Prediction (before running): the 3a median (6.4%) moves by more than a factor of 2 across k = 0.5 to 2: prior 70%. Refuted if it stays within 3.2% to 12.8%.
### Outcome of 3b (experiments/flow_share_shape_results.txt, 3 s, seeded; 1 new test, all pass)
p_n 10.9 bar: median penalty 21.6% (k 0.5), 5.8% (k 1), 0.0% (k 1.5, 2, 3); p95 21.6, 21.6, 21.6, 9.6, 1.9. Dig phases at the stall bound: 82.9, 34.7, 10.3, 1.1, 0.0%. Prediction held.
p_n 1.44 bar: median 21.6% for every k up to 2 and 20.0% at k = 3: the stall bound is hit in 49 to 100% of dig phases whatever the closing law.
Reading: 3a's "median 6.4%" is a statement about one assumed closing law, not about open-centre valves. What is robust is the sign (never faster than load-sensing) and that a low neutral drop (1.44 bar) leaves little pressure rise to unstall the heavy actuator. How fast a real spool closes its bypass is a datasheet quantity (the PVG 32 curve behind 2n has it) and is the next thing to source.
Limits: k is a single-number family, not a measured area curve; the factor-2 stall bound is still an assumption; no dynamics.
Next: fit k from the PVG 32 bypass-versus-spool-stroke data behind 2n, then rerun 3a with it.
2026-10-30 · Milestone 3a: how much longer does an open-centre parallel valve make the dig phase? (planned before running)
Why: milestone 3 (dynamics) was never started and every ranking so far is energy only; cycle time is the other half of the question. Full dynamics (compensator, line volumes) need component data I do not have, so this step is the steady-state part: src/heavy_hydraulics/flow_share.py, orifice sections sized to pass their demand alone, a bypass that closes as sections open, p_n 10.9 bar (2n) and 1.44 bar (2i), 5 x 1,000 random cycles of 2d. Only the dig phase has two actuators. No operator feathering (so an upper-ish bound before a person corrects it); a stalled actuator (supply pressure below its load) is charged the bound factor 2 (sequential motion).
Prediction (before running): median cycle-time penalty under 2% but 95th percentile 10% or more (prior 55%): most cycles lose little because the closing bypass lifts supply pressure, a tail where the high-pressure actuator stalls. Refuted if the median is 2% or more, or the 95th percentile is under 10%.
Limits known in advance: orifice law, one bypass shape (area closes linearly with section area), sections sized alone, no compensator dynamics, no line volume: this is not yet the dynamic model.
### Outcome of 3a (experiments/flow_share.py, flow_share_results.txt, about 1 minute, seeded; 3 new tests, 10 pass)
p_n 10.9 bar: cycle-time penalty median 6.4%, 95th percentile 21.6% (the cap); 65.5% of cycles slow at all; 35.6% of dig phases sit at the stall bound (factor 2). p_n 1.44 bar: 21.6% median, 98.4% of dig phases at the bound.
Prediction half refuted: median 6.4% is not under 2% (the 95th percentile of at least 10% held). The closing bypass did not save most cycles.
Reading: with no operator feathering, an uncompensated open-centre valve loses real cycle time in the dig phase because the lighter actuator takes the flow, and a freer centre (smaller p_n) makes it worse, not better. That is a cost the energy-only rankings (2f to 2o) leave out, and it works against open-centre exactly where 2i to 2k had it winning on energy. Load-sensing is 1.0 here by construction, so the comparison is one-sided until a compensator model exists.
Limits: the 21.6% cap and the 98% stall share are mostly the bound I set (factor 2), not a measurement; the result depends on sizing each section alone and on the linear bypass closure; real operators feather. Treat it as a direction (open-centre pays in time, not only in energy), not a number. Next: a dynamic model with pressure compensators and a feathering rule, then a time-penalised energy ranking.
2026-10-30 · Milestone 2o: how far does the unsourced LS standby flow move 2n's break-even? (planned before running)
Why: 2m and 2n both end with "a standby flow from a pump datasheet". Hosts for datasheets are still unreachable, so sweep it instead: experiments/standby_sweep.py, p_n 10.91 bar (2n), load factor 0.346, q_sb 0, 1, 2, 4, 6, 8, 10 L/min, dp_ls 10 to 40 bar.
Prediction (before running): break-even falls monotonically with q_sb, reproduces 28.0 bar at 2 L/min, is above 30 bar at 0 and below 25 bar by 8 L/min (prior 70%), so at q_sb of 6 L/min or more the thesis 25 bar margin loses again. Refuted if non-monotone, or if the 8 L/min break-even is 25 bar or more.
### Outcome of 2o (experiments/standby_sweep.py, standby_sweep_results.txt, about 1 minute, seeded)
Break-even dp_ls (bar) by standby flow: 29.1 (0 L/min), 28.5 (1), 28.0 (2, reproduces 2n), 26.9 (4), 25.9 (6), 25.0 (8), 24.0 (10). Monotone; about 0.5 bar of margin lost per L/min.
Prediction refuted on both numeric lines. At 0 L/min the break-even is 29.1, not above 30; at 8 L/min it is 25.0 (not under 25). Direction and the 2 L/min reproduction held.
Reading: the standby flow, unsourced, is a weak lever: across 0 to 10 L/min the break-even stays within 24 to 29 bar, so the thesis 25 bar margin sits on the boundary only for 8 L/min or more, and the Rexroth 14 bar margin wins at every standby flow tested (LS/OC 0.75 to 0.80). 2n's ranking (load-sensing ahead at both sourced margins) holds unless the pump's standby flow is about 8 L/min or more, which is large for a 45 L/min pump.
Limits: same as 2n (one valve curve reading, one load factor); the standby flow is swept, not sourced.
Next: a sourced standby flow would only narrow a 5 bar band; larger remaining gaps are the dynamic model (milestone 3) and a measured trace (H4).
2026-10-30 · Milestone 6c: paper draft regenerated for 2n (no new experiment)
Added section 3.1d, revised the abstract, threat 2/limits text and 'what would settle it' (b) to carry the PVG 32 neutral drop (10.9 bar, break-even 28.0 bar). paper/check_numbers.py now checks 22 claims, 0 missing. Danfoss, Rexroth and Zenodo hosts all refuse connections this session, so no standby-flow source was reachable.
2026-10-30 · Milestone 2n: with the open-centre neutral drop read from Danfoss's PVG 32 curve, who wins at idle? (planned before running)
Why: every ranking since 2i hinged on p_n = 1.44 bar from one Salami valve catalogue (a 75 L/min valve, no input module). This session the Danfoss host is reachable. The PVG 32 Technical Information (BC152886483664, rev. May 2021; PDF opened, p. 16) has a curve "pressure drop, bypass in neutral" for its open-centre PVP input module: about 8.5 bar at near-zero flow rising linearly to about 16 bar at 140 L/min (read off the figure, +-0.5 bar). PVG 32 is a mobile/excavator-class proportional valve, rated 140 L/min. At the model's 45 L/min pump, p_n = 8.5 + 7.5 x 45/140 = 10.9 bar. The same manual has no LS margin or standby flow I could find (searched for margin, standby, bypass in the German text); the pump's are still 2j's.
Plan (experiments/pvg_neutral.py, ratio from 2g, load factor 0.346, LS standby 2 L/min assumed, 600 cycles x 5 seeds): p_n = 10.9 bar (and the +-0.5 bar reading band at both ends: 10.4 and 11.4), dp_ls 10, 14, 20, 25, 28 bar, and the break-even dp_ls by interpolation on a 2 bar grid.
Prediction (before running): the break-even dp_ls is about 28 bar (2l's line 19.3 + 0.92 (p_n - 1.44) gives 28.0; prior 70%), so load-sensing wins at 14, 20 and 25 bar, both sourced margins, reversing 2i for this valve. Refuted if the break-even is under 25 or over 31 bar, or if LS/OC at dp_ls 25 is 1.0 or more.
Limits known in advance: the drop is the PVP module's bypass curve (sections add more in neutral, so p_n here is if anything low); a figure reading; a Danfoss valve paired with a Rexroth LS margin; one load factor; standby flow assumed.
### Outcome of 2n (experiments/pvg_neutral.py, 8 s, seeded; pvg_neutral_results.txt)
p_n at 45 L/min is 10.91 bar. Break-even dp_ls 28.0 bar (27.5 to 28.4 across the +-0.5 bar reading band); LS/OC median is monotone in dp_ls.
Prediction held (28.0 against "about 28", inside 25 to 31; LS/OC at 25 bar is 0.949, under 1.0). LS/OC median at dp_ls 14: 0.759 (LS worse in 0.8% of cycles), 20: 0.863 (11.8%), 25: 0.949 (33.6%).
Reading: on a PVG 32-class excavator valve's own bypass curve, load-sensing uses less shaft energy than open-centre at the measured load factor for BOTH sourced margins (Rexroth 14 bar, thesis 25 bar), up to a margin of 28 bar. This reverses 2i (which used a 1.4 bar neutral drop from a 75 L/min catalogue valve) and 2l's "no further simulation resolves the sign": the neutral drop that matters for an excavator-class valve is about 11 bar, not 1.4. 2f's headline (load-sensing saves energy at the measured load factor) is back, now with a sourced p_n. The open-centre neutral drop of a valve with sections adds to this, so 10.9 bar is if anything low.
Limits: as planned. A figure reading (+-0.5 bar), one manufacturer, the LS margin and standby flow are not from the same machine, the Salami and Danfoss values differ by 9.5 bar because the Danfoss curve is for the input module's bypass (relief/bypass path) and I have not shown which one a given excavator's neutral path matches.
Next: a standby flow and a working LS margin from one pump family; regenerate the paper's ranking table with p_n 10.9 (the draft's ranking claims cite 2i's caveat).
2026-10-30 · Milestone 2m: how far does the break-even LS margin move with load factor? (planned before running)
Why: 2l's "Next": it is one load factor (0.346, the measured one). A reader's machine idles more or less than that. experiments/ranking_map_lf.py, 2l's model unchanged, load factor 0.15, 0.25, 0.346, 0.5, 0.7, p_n 1.44 and 6.44 bar, dp_ls 4 to 60 bar.
Prediction (before running): the break-even falls monotonically as load factor rises (less idle time means less for load-sensing's low idle power to win back), from above 30 bar at 0.15 to under 20 bar at 0.7 at p_n 1.44, and at 0.346 it reproduces 2l's 19.3 (prior 80%). Refuted if non-monotone in load factor, or if the 0.7 break-even is 20 bar or more.
### Outcome of 2m (experiments/ranking_map_lf.py, 20 s, seeded; ranking_map_lf_results.txt)
Break-even dp_ls (bar) at p_n 1.44: 12.9 (load factor 0.15), 16.8 (0.25), 19.3 (0.346, reproduces 2l), 21.7 (0.5), 22.9 (0.7). At p_n 6.44: 25.5, 24.5, 23.9, 23.3, 23.1. Monotone in dp_ls in every row.
Prediction refuted on direction. I expected the break-even to fall as load factor rises. It rises at p_n 1.44 (12.9 to 22.9): with a near-free open-centre neutral (1.44 bar), idle time favours open-centre because load-sensing pays dp_ls on its standby flow, so the more a machine idles, the lower the LS margin load-sensing needs to win. Only when the open-centre neutral costs about 6 bar does idle favour load-sensing (break-even falls slightly, 25.5 to 23.1). The 0.346 row reproduces 2l (19.3, 23.9) and the 0.7 value is 22.9, over my 20 bar refutation line, so both stated refutation conditions fired.
Reading: the sign of the circuit gap depends on load factor only when p_n is small. For the Rexroth 14 bar margin, load-sensing wins at every load factor tested with p_n 1.44 except 0.15 (14 is above 12.9); for the thesis 25 bar it loses at every load factor at p_n 1.44, and at 6.44 wins only at 0.15 (25 against 25.5, inside interpolation error). The measured margin and neutral pressure still decide it; load factor does not rescue either side.
Limits: standby flow 2 L/min assumed (it scales the idle effect directly); one valve drop source; break-even by interpolation on a 4 bar grid.
Next: a standby flow from a pump datasheet, since it multiplies the idle term that this run shows drives the load-factor dependence.
2026-10-30 · Milestone 2l: where is the sign boundary in (dp_ls, neutral drop)? (planned before running)
Why: 2i to 2k each moved one input and flipped the ranking. Network hosts for new sources (assets.danfoss.com, zenodo.org, rwth/polito repositories, arxiv.org) all refuse connections from this session, so no new source this run; what the paper can use instead is the boundary itself, so a reader with their own machine's two numbers can read the answer off.
Plan (experiments/ranking_map.py, reuses 2g ratio, load factor 0.346, LS standby 2 L/min assumed, 600 cycles per seed x 5 seeds): dp_ls 8 to 32 bar in steps of 2 against open-centre neutral pressure p_n = 1.44 (valve only, 2i), 6.44 (+5), 11.44 (+10) bar. Break-even dp_ls by linear interpolation of the median crossing 1.0, and a figure.
Prediction (before running): break-even dp_ls is about 20 bar at p_n 1.44 (2k), 25 to 27 at 6.44, 30 to 33 at 11.44, i.e. about 1.0 to 1.2 bar of dp_ls per bar of p_n (prior 75%). Refuted if the slope is under 0.8 or over 1.5, or if the median is non-monotone in dp_ls.
### Outcome of 2l (experiments/ranking_map.py, about 10 s, seeded; ranking_map_results.txt, ranking_map.svg)
Median LS/OC is monotone in dp_ls in all three rows. Break-even dp_ls: 19.3 bar (p_n 1.44), 23.9 (6.44), 28.4 (11.44); slope 0.92 bar per bar.
Prediction scorecard: 19.3 vs "about 20": held. 23.9 vs "25 to 27": missed low. 28.4 vs "30 to 33": missed low. Slope 0.92 vs "1.0 to 1.2": missed low, though inside the 0.8 to 1.5 refutation window, so the structural reading (a one-for-one trade between the two margins, a little less because neutral flow is the whole pump flow only in idle time) stands; my numeric band was too high.
Reading: the two numbers a reader needs are the machine's LS margin and the neutral pressure drop of its open-centre alternative; load-sensing wins below the line dp_ls* = 19.3 + 0.92 (p_n - 1.44) bar at this load factor. The Rexroth 14 bar and thesis 25 bar values lie on opposite sides of it for any plausible p_n, so no further simulation resolves the sign; a measured margin does.
Limits: one load factor (0.346), standby flow 2 L/min assumed, the line is fitted to three points, work-phase margins use the same dp_ls (as in 2j).
Next: unchanged from 2k (a working LS margin from a main-valve datasheet; hosts must be allowed); a second load factor for the boundary.
2026-10-30 · Milestone 2k: a third LS margin (20 bar) puts the break-even between 14 and 25 bar (exploratory: no predictions written before running)
Why: 2j's "Next" was a working LS margin for an excavator main valve. Search found the Danfoss PVG 32 Technical Information (excerpt only): the pump LS control holds a set margin between P and LS, with a worked example of 20 bar. I could NOT open the document (assets.danfoss.com and hydraulicsonline.com do not resolve from this session; they would need allowing in the network settings), so 20 bar is a search-excerpt value, an example not a recommendation, and its page is unchecked. No standby flow found.
Run (dpls_sourced.py with 20 bar added; 2 s; same settings as 2j): dp_ls 20: LS/OC median 1.014 (extra 0) and 0.928 (extra 5); LS worse in 54.9% and 26.7% of cycles. Rows for 25, 14, 10 unchanged from 2j.
Reading: at the valve-only neutral drop the circuits tie near dp_ls 20 bar (median 1.01); below that LS wins, above it open-centre wins. The three candidate margins (14 Rexroth, 20 Danfoss example, 25 thesis) straddle the tie, so the ranking sign is still unresolved, as 2j said, and now bracketed more tightly: the break-even is about 20 bar with no extra neutral drop and about 25 to 26 bar with 5 bar extra.
Limits: the 20 bar is an example in an unopened document; standby flow assumed; one load factor.
Next: open the PVG 32 / pump documents once the hosts are reachable (or an excavator service manual) for a working margin and standby flow.
2026-10-29 · Milestone 2j: the load-sensing margin from Rexroth's A10VO manual flips 2i's ranking back (exploratory: no predictions written before running)
Why: 2i's standing "Next" was to source the LS side. The model's dp_ls 25 bar came from one thesis model of a midi excavator (Briganti 2022). Rexroth Canada's A10VO Technical Information Manual, Module 3A (rev. 2.0, 2006), s. 7.2 (opened; PDF text extracted), gives the factory standby setting as "usually 200 PSI" = 13.8 bar. Reseller listings (not manufacturer documents) give an LS differential of 14 bar for A10VO DFR/DFR1 units and standby pressures of 18 to 20 bar for two units; I did not find a standby flow in L/min anywhere, so q_sb stays an assumed 2 L/min.
Run (experiments/dpls_sourced.py, dpls_sourced_results.txt, ratio in idle_models.py now takes dp_ls, default unchanged; 3,000 cycles per cell, load factor 0.346, 4 sections, 2i's valve drop 1.44 bar plus an assumed extra 0 or 5 bar): - dp_ls 25: LS/OC median 1.115 (extra 0) and 1.021 (extra 5); reproduces 2i (1.08 to 1.12). - dp_ls 14: 0.893 (LS worse in 15.9% of cycles) and 0.817 (2.7%). - dp_ls 10 (sweep): 0.811 and 0.741.
Reading: 2i's reversal ("open-centre ahead by about 10%") rests on dp_ls 25 bar. At the 14 bar the Rexroth manual's standby setting and reseller listings point to, load-sensing is ahead by 11 to 18% even with 5 bar of extra neutral drop. The ranking is now set by dp_ls, not p_n: the two sourced inputs disagree by 11 bar on it (a midi-excavator model versus a 45 cm3 industrial-mobile pump family), and both are single sources. Neither supersedes the other; the honest statement is that the sign of the circuit gap is unresolved until a measured excavator margin is found.
Limits: standby pressure is not identical to the working-point LS differential (the manual gives standby only); q_sb 2 L/min assumed; 25 bar may be right for the valve block of an excavator (compensators and flow-sharing add margin); one pump family.
Next: find the working LS margin of an excavator main valve (valve datasheet, "LS differential pressure" or "pump margin pressure"), and a standby flow; then regenerate the 2g table and the paper's ranking table. The paper draft's ranking claims must not cite 2i without this caveat.
2026-10-29 · Milestone 2i: with the open-centre neutral pressure read from a published valve curve, who wins at idle? (planned before running)
Why: the log's standing "Next" (since 2h): the ranking reduces to one number, p_n, and no source was found. This session found one: the Salami VD8A sectional-valve catalogue (PDF from psifluidpower.ca, opened and read; E0.06.0911.02.02), nominal 75 L/min, text "approximatively 1 bar for each spool at nominal flow" with spools in neutral, and a P-to-T curve per spool count (p. 7) that reads about 12.7 bar at 90 L/min for 8 spools (read off the figure, +-0.5 bar). Drop scales as Q^2. At the model's 45 L/min pump that is about 0.36 bar per section by the text, 0.4 by the curve.
Plan (experiments/neutral_sourced.py, 2g's ratio, load factor 0.346, LS standby 2 L/min): p_n = valve drop for 3, 4, 6, 8 sections under both readings (text, curve), plus an ASSUMED extra 0, 2 or 5 bar for return line, filter and cooler (not in a valve catalogue). Report LS/OC median (5 to 95%) and the share of cycles where LS loses.
Predictions (before running): (1) valve-only (extra 0) LS/OC is above 1.05 for every section count up to 8, both readings (prior 85%): p_n* in 2h was 6.4 to 10.8 bar and the valve alone is under 4 bar. (2) With extra 5 bar and 4 sections or fewer, LS/OC stays above 1.0 (prior 80%). (3) The text and curve readings give p_n within 1 bar of each other at 4 sections (prior 70%). Refuted: (1) any cell at 1.05 or under; (2) any such cell below 1.0; (3) gap of 1 bar or more.
Limits known in advance: one catalogue, one manufacturer's valve, a 75 L/min class part rather than an excavator block; a figure reading; excavators add boom-holding, anti-cavitation and flow-share elements, and many open-centre blocks have a parallel-series path with more drop; the extra bar is assumed; the LS side (standby, dp_ls 25 bar) is still unsourced.
### Outcome of 2i (experiments/neutral_sourced.py, about 1 minute, seeded; experiments/neutral_sourced_results.txt; 3,000 cycles per cell)
Valve drop at 45 L/min: 1.1 to 1.2 bar (3 sections), 1.4 to 1.6 (4), 2.2 to 2.4 (6), 2.9 to 3.2 (8); the text and curve readings differ by under 0.4 bar everywhere.
(1) held: valve-only LS/OC median is 1.081 to 1.122 in every cell, i.e. load-sensing uses 8 to 12% MORE shaft energy than open-centre at the measured load factor; LS is the worse circuit in 72 to 80% of cycles.
(2) held: with an assumed extra 5 bar and 3 or 4 sections the ratio is 1.019 to 1.027, still above 1.
(3) held: the readings differ by 0.15 bar at 4 sections.
Reading: on this valve family the open-centre neutral drop is a few bar, below the 6 to 11 bar break-even of 2h, so 2f's headline "load-sensing saves 21% at the measured load factor" does not survive a sourced p_n; it flips to open-centre ahead by about 10% unless something else in the neutral path (return filter, cooler, a high-drop excavator block, a relief-limited bypass) adds 6 to 8 bar. Together with 4 (payback not met) this makes the sourced case against load-sensing on a small excavator, for energy, stronger. It remains a single manufacturer's 75 L/min-class valve; the LS side (dp_ls 25 bar, standby flow) is still unsourced and is the next input.
Limits: as planned. The 8-spool figure value is a reading, the extra bar is assumed, and 2h's finding stands that whichever way the ranking falls it is set by p_n and dp_ls.
Next: source dp_ls (LS margin pressure; pump datasheet) and an excavator-class open-centre block drop; regenerate the 2g table and the paper's ranking table with the sourced p_n.
2026-10-29 · Milestone 6b: figure and number check for the paper draft
No new experiment. Added experiments/figure.py (LS/OC median against load factor for four open-centre idle models, parsed from idle_models_results.txt) and paper/check_numbers.py (13 draft claims matched against the results files they cite; 0 missing). The figure shows 8 bar neutral pressure is the only curve above 1, and only at load factor 0.5 (1.020).
Still open before the paper is ready: a measured hydraulic trace (H4), a sourced neutral pressure drop, an LS valve price, arm mass; citations opened and run through cite_check.py.
No new experiment. Drafted the paper from the landed results (paper/draft.md): abstract, model, ranking-versus-idle table, metering bound, payback, recovery bound, threats and "what would settle it". Every number was copied from a results file; the one I re-checked against the files before writing was the sourced no-idle LS/OC median (1.043; 12,503 of 20,000 cycles, 62.5%).
Not paper-ready: no measured hydraulic trace (H4 untested), the neutral pressure drop and LS valve price are unsourced, citations were confirmed by search only (Crossref 403), and no figure exists yet. The draft lists these as the four inputs that would settle it.
Next: source one of the four inputs (neutral pressure drop first, since the ranking reduces to it), then figures and a check_numbers.py.
2026-10-29 · Milestone 5b: does 5a's lift-phase cap decide its numbers? (experiments/regen_uncapped.py, regen_uncapped_results.txt)
Prediction written before running: at the central point the cap never binds (uncapped = capped); at the upper corner (600 kg, 1.2 m, 0.92) it binds in most cycles and the uncapped share is above 10%. Refuted if the central cap binds in more than 5% of cycles.
Outcome (5,000 cycles, same force model, sourced margins): central point (300 kg, 0.8 m, 0.7) uncapped 3.33% (open-centre) and 3.21% (load-sensing), identical to 5a's, cap binds in 0.0% of cycles. Lowest corner and (150 kg, 1.2 m, 0.92) also never bind (0.5%, 3.9%). Upper corner: uncapped 11.8% / 11.4% against 5a's 10.0% / 10.3%; the cap binds in 75% of cycles (26% at eta_rt 0.7, where uncapped is 9.0% / 8.7%). Both predictions held.
Reading: 5a's central 3% needs no cap, so the doubt about the force model's non-physical lift phase (5.6x m g dh) does not touch it; only the quoted upper-corner 10% was cap-limited, and the uncapped figure is about 12%. Recovery stays a 1 to 12% lever on working-time shaft energy for swept, unsourced arm mass and drop height. Still no idle time, dynamics, accumulator sizing or price.
Next: source an arm mass, price an accumulator or e-machine, then the paper draft (milestone 6).
2026-10-29 · Milestone 5a: how much of a cycle's pump-shaft energy can boom-lowering recovery return, and does it beat the circuit choice? (planned before running)
Why: milestone 5 (energy recovery) is the last unbuilt rung before the paper, and 4 found fuel does not repay load-sensing. Is recovery a bigger lever than the circuit? experiments/regen_bound.py (stdlib, seconds). Per force-model cycle (physics_cycle.one, 20,000 cycles) the recoverable energy is E = (m_arm + m_load) g dh, with m_load the model's bucket-plus-soil mass, m_arm (boom, stick, bucket, effective at the boom cylinder) swept 150 to 600 kg and dh swept 0.5 to 1.2 m. Neither m_arm nor dh is sourced (component masses are not published for this class; swept, not chosen). Round-trip efficiency eta_rt is swept 0.3 to 0.92; the literature anchors found by search only (abstracts, not opened): 67.6% potential-energy reuse (dual-power boom, electric excavator, theory and experiment), 86% (digital pump with accumulator, simulation), up to 92% (1.6 t electro-hydraulic, simulation), 44.6% whole-cycle saving (50 t hybrid prototype, experiment). The saving is capped by the lift phase's shaft energy under each circuit (what the recovered energy can displace). Reported as a share of the cycle's open-centre and load-sensing shaft energy (no idle time added, so an upper bound on the share over working hours), next to the LS/OC gap.
Consistency check I also run: the model's lift phase draws pressure x flow x time of useful work, which should be about m g dh for a real lift; the ratio of the model's lift useful energy to m g dh says whether the force model's lift phase is physical.
Predictions (before running): (1) at the central point (m_arm 300 kg, dh 0.8 m, eta_rt 0.7) the recovered share of cycle shaft energy is under 5% at the median, in both circuits. (2) Even at the upper corner (600 kg, 1.2 m, 0.92) the median share stays under 10%, so recovery tops out well below the 21% LS-over-OC gap at the measured load factor (2f). (3) The model's lift useful energy exceeds m g dh by at least 3x in the median cycle, i.e. the force model overstates lift work, which means its lift pressures are not purely gravitational. Refuted: (1) 5% or more; (2) 10% or more; (3) ratio under 3.
Limits known in advance: potential energy of the arm only (no swing-brake or cylinder regen); m_arm and dh are swept; the recovery is not simulated dynamically (no accumulator sizing, no 3 s harvest-window limit that a review notes); cycles carry no idle time.
### Outcome of 5a (experiments/regen_bound.py, about 10 s; regen_bound_results.txt; 5,000 force-model cycles, sourced margins)
Median recovered share of cycle pump-shaft energy (open-centre / load-sensing), capped by lift-phase shaft energy: central point (300 kg, 0.8 m, eta_rt 0.7) 3.3% / 3.2%; lowest corner (150 kg, 0.5 m, 0.3) 0.5%; upper corner (600 kg, 1.2 m, 0.92) 10.0% / 10.3%. The two circuits differ by under 0.3 points, so the choice of circuit barely changes what recovery can return.
(1) held (3.3% and 3.2%, under 5%). (2) refuted, narrowly: the upper corner is 10.01% (open-centre) and 10.26% (load-sensing), not under 10%. (3) held: the force model's lift useful work is a median 5.6 times m_load g (0.8 m) (5 to 95%: 2.9 to 10.5), so its lift phase is not gravity alone: it also carries a pressure floor (idle_u) and the arm's own weight, which I did not separate.
Reading: with unsourced arm mass and drop height swept over a 4x and 2.4x range, boom-lowering recovery is worth roughly 1 to 10% of cycle shaft energy at working time, 3% centrally, even at a 92% round trip. That is the same order as the load-sensing margin effect, and unlike load-sensing it costs an accumulator or an electric machine that this programme has not priced. I did NOT compare it with the 21% idle-time LS-over-OC gap of 2f: this run adds no idle time, and on a no-idle cycle LS/OC is 1.039 (LS loses, as 2d found), so the planned comparison to 21% was not like-for-like. Idle time lowers every share here further.
Limits: m_arm, dh, eta_rt swept not sourced (the recovery efficiencies are from search abstracts, not opened papers); no dynamics, accumulator sizing or harvest-window limit; the cap uses the lift phase only; lift phase work is not physical (3), so the cap may be generous.
Next: separate the lift phase into gravity and friction (so the cap is physical), price an accumulator or e-machine (milestone 4 style), and source a boom/arm mass.
2026-10-29 · Milestone 4 (first pass): does load-sensing's extra parts cost repay in fuel within 2,000 h (H5)?
Not pre-registered (written and run in one step; experiments/payback.py, payback_results.txt; 2,500 cycles per p_n). Prediction recorded before reading the output: payback would exceed 2,000 h at every p_n tested except possibly 40 bar. It did exceed 2,000 h everywhere.
Sources found this session (retail listings, read 2026-10-29, prices move): Kawasaki K3VL28 load-sensing 28 cc piston pump $1,707.99 (OneHydraulics, sale); 28 cc Group 2 gear pump GBP 113.40 ex VAT (Hydraulic Megastore, UK; converted at an assumed 1.30 USD/GBP); Youli MB-3 3-section open-centre monoblock $342.99 (OneHydraulics, sale); diesel $6.276/US gal, EIA week to 2026-10-19, read from a secondary news summary, not EIA. No public price exists for a load-sensing sectional valve (Danfoss PVG and Walvoil quote on request), so its premium is swept at 1x to 5x the monoblock. Neutral-position pressure drop for open-centre valves: the Walvoil catalogue host reset the connection and search snippets give curves only, so 2h's open question (a sourced p_n) is still open.
Result (LF 0.346, q_sb 2 L/min, mean shaft power saving LS vs OC): p_n 8 bar 0.02 kW; 20 bar 0.43 kW; 40 bar 1.10 kW (0.005, 0.127, 0.329 L/h at BSFC 250 g/kWh, assumed). At $6.28/gal and the pump premium alone ($1,561, LS valve priced equal to the monoblock) payback is 181,000 h (8 bar), 7,400 h (20 bar), 2,860 h (40 bar); with the valve at 5x it is 340,000, 14,000 and 5,400 h. Cheapest cell in the whole grid, $7/gal, 40 bar, equal valve: 2,566 h.
Reading: H5 is refuted on this machine size, duty cycle and these parts in every cell of the grid, so on this evidence load-sensing's case on a small excavator is not fuel cost. That is the comparison of a piston LS pump with a gear pump; the piston pump also brings other things (controllability, no relief-valve heating, speed-independent flow) that fuel does not price, and a cheaper LS route (gear pump with a priority or flow-sharing valve) is not modelled.
Limits: parts are retail listings of different brands and quality classes, not OEM costs; LS valve price unsourced; BSFC assumed; diesel from a secondary summary; 28 cc pump at 1,800 rpm is about 50 L/min against the model's 45 L/min pump; the energy side inherits every limit of 2g (assumed idle demand, p_n, a load factor from a different machine's electrical power). Independent metering (H2) is not costed.
Next: a sourced centre-bypass drop at neutral (unblock a datasheet), a metering valve price, then energy recovery (milestone 5).
2026-10-29 · Milestone 2h: at what open-centre neutral pressure does load-sensing stop winning?
Not pre-registered (written and run in one step; experiments/idle_breakeven.py, idle_breakeven_results.txt, 1,500 cycles per evaluation, 12-step bisection). Purpose: 2g left the ranking dependent on two unsourced numbers; this finds the break-even so a datasheet reading decides it. Datasheet hosts (Rexroth PDFs, Zenodo) were unreachable from this session, so no sourced value was added; a retailer page claiming an 18 bar standby and 14 bar margin for an A10VO is unverified and not used.
Result: the neutral pressure p_n above which median LS/OC < 1, with LS standby flow 0 to 8 L/min: load factor 0.346: 6.4 to 10.8 bar; 0.375: 6.8 to 11.2 bar; 0.5: 10.5 to 14.9 bar. Each extra L/min of standby flow moves p_n by about 0.5 bar.
Reading: the whole question reduces to one number, the pressure an open-centre block holds with levers neutral. If it is above about 11 bar (a typical centre-bypass drop through several valve sections is plausibly in that range, but I have no source), load-sensing wins at the measured load factor for any standby flow tested; below about 6 bar it loses. Standby flow matters far less than p_n.
Limits: same assumptions as 2g (idle demand, margins from two different machines); p_n and q_sb remain swept, not measured. H4 still untested.
Next: a sourced centre-bypass pressure drop at neutral (valve datasheet or measured paper), then parts cost (milestone 4).
2026-10-29 · Milestone 2g: does 2f's idle-time ranking survive a physical idle model for each circuit?
Not pre-registered: written and run in one step (experiments/idle_models.py, idle_models_results.txt). Check on the script: its "OC bleed, LS standby 0" cells reproduce 2f's table exactly (0.942, 0.820, 0.786, 0.662), so only the idle charge changed.
Method: 2f charged idle to open-centre as full pump flow at (p + 6 bar) and to load-sensing with no standby flow. Here open-centre idles through its centre bypass at a neutral pressure p_n (40, 20 or 8 bar) and load-sensing pays its idle demand at (p + 25 bar) plus a standby flow q_sb (0, 2 or 6 L/min) at 25 bar. p_n, q_sb and the idle demand are assumed (swept, no measured source).
Result (LS/OC median; share of cycles with LS > OC), at the measured load factor 0.346: p_n 40 bar, q_sb 0: 0.643, 3.3%; p_n 20: 0.819, 10.4%; p_n 8: 0.981, 43.9%; p_n 8 with q_sb 6: 1.035, 61.1%. At 0.375 the same corner gives 0.991 (46.9%) to 1.035 (61.2%). At 0.25, p_n 8 gives 0.939 to 1.031.
Reading: 2f's "load-sensing wins by about 21% at the measured load factor" is not robust. It depends on how much pressure the open-centre bypass holds at neutral. A bypass at 8 bar or lower with a 2 to 6 L/min load-sensing standby flow erases the advantage (ratio 0.98 to 1.04); a 40 bar neutral bypass doubles it (0.64). The 2f figure was a mid-range point, not a lower bound as I wrote there: the two biases I named pushed in opposite directions and the neutral pressure moves the answer more than the standby flow does. The structural conclusion stands: the ranking is set by duty cycle and idle architecture, and H1 stays duty-cycle-dependent.
Limits: p_n and q_sb are assumptions; no measured idle power of either circuit; electric-excavator load factor from a different machine; the idle demand is the same as 2f's.
Next: a source for open-centre neutral pressure drop and load-sensing standby flow (a pump or valve datasheet), then the parts-cost step (milestone 4).
2026-10-29 · Milestone 2f: does 2d's "load-sensing loses" survive idle time matched to a measured load factor?
Not pre-registered: I wrote the script and ran it in the same step, so there is no prediction to score. What I can say honestly is that 2e's third prediction (a measured trace "would push LS further against open-centre") was reasoned in the wrong direction: low-load time is where a fixed-flow open-centre pump bleeds its whole output, so idle time helps load-sensing.
Method (experiments/idle_sensitivity.py, idle_sensitivity_results.txt): append one idle phase (2 to 8 L/min at 10 to 25 bar, assumed) to each 2c force-model cycle, long enough that the cycle's load factor (mean useful power / peak phase power) hits a target; margins as 2d (6 bar spool, 25 bar LS, eta 0.883, dp_m swept); 5,000 cycles per row. Targets include the measured 0.346 (full trace) and 0.375 (80 s digging trace) from 2e.
Result (LS/OC median; share of cycles with LS > OC): no idle (2d) 1.039; 61.1%. LF 0.5: 0.942; 34.9%. LF 0.375: 0.820; 12.5%. LF 0.346: 0.786; 8.4%. LF 0.25: 0.662; 0.6%. LF 0.15: 0.508; 0%. Metered/LS stays 0.64 to 0.66 throughout.
Reading: 2d's headline (LS loses to open-centre at a 25 bar margin) holds only for cycles with no idle time. At the load factor of the one measured trace available, load-sensing is a median 21 to 21.4% below open-centre in energy and loses in 8 to 12% of cycles. The break-even load factor is near 0.5 to 0.55. So the ranking depends on duty cycle, which is what the programme's question asks; H1 is neither confirmed nor refuted as a structural claim, it is duty-cycle-dependent.
Limits: the load factor comes from electrical input power of a larger electric machine (2e), not hydraulic power; idle demand and pressure are assumed; open-centre idle is the full-flow bleed (pessimistic for OC, and a real machine may unload the pump), while LS idle ignores standby flow (optimistic for LS). Both biases favour LS, so the 0.79 to 0.82 is probably a lower bound on LS/OC. Still no measured hydraulic trace, so H4 is not tested.
Next: model OC unloading and LS standby flow (the two biases above), then the parts-cost step (milestone 4).
2026-10-29 · Milestone 2e: does the assumed cycle's load shape look like a measured excavator's? (planned before running)
Data: Zenodo record 18862594, "Off-road electric power profile" (CC-BY-4.0), the raw electric power of an electric excavator from a CWA pre-normative power profile: ElectricExcavator_profile.csv (0.1 s samples, 1,778.9 s, peak 133.1 kW, repeated digging and grading) and Digging_profile.csv (80 s). Copied to experiments/data/. It is electrical input power of one machine whose circuit I do not know, not hydraulic pressure: it cannot rank circuits, and its absolute level (133 kW) is far above the 45 L/min x 180 bar force model (13.5 kW at relief). Only the shape is comparable.
Question: the 2c/2d rankings hinge on how much of the cycle is low-load (a fixed LS margin costs most there). Is the force model's time profile of useful hydraulic power (sum of p x q over actuators, per phase, 20,000 cycles from physics_cycle.one) like the measured trace's? Statistics, each normalised by the trace's own peak: load factor (mean power / peak) and share of time below 30% of peak.
Measured, computed before writing this (full trace): load factor 0.346; share below 10/20/30/50% of peak 0.16/0.33/0.51/0.73.
Predictions (before running the model side): (1) model median load factor is above the measured 0.346 by at least 0.1, because the model's phases are constant-power blocks with no idle or ramp time and peak is one phase; (2) model share of time below 30% of peak is below the measured 0.51; (3) so if anything the model under-represents the low-load time that hurts load-sensing, and 2d's "LS loses" finding is, on this evidence, not an artefact of too many low-load phases. Refuted if the model's load factor is within 0.1 of 0.346 or below it.
Not tested: any circuit energy from the trace; its split between hydraulic and electrical losses is unknown.
Measured full trace: load factor 0.346; time below 10/20/30/50% of peak 0.163/0.330/0.515/0.726. The 80 s digging-only trace: 0.375 and 0.081/0.296/0.340/0.765.
Model (20,000 cycles): load factor median 0.606 (5 to 95%: 0.406 to 0.781); time below 30% of peak median 0.135 (0 to 0.595); below 10% of peak 0 in more than 95% of cycles.
Predictions 1 and 2 supported: the model's load factor is 0.26 above the measured one, and even its 5th percentile (0.406) is above both measured traces. The model has less low-load time than the machine did.
Prediction 3 only half-holds. The model under-represents low-load time, so on this evidence the 2d result "a fixed LS margin costs more than it saves" is not inflated by too many idle phases; if anything a measured trace, with more time at low power, would push LS further against open-centre at constant margin. But the comparison is weak: the trace is electrical input power (includes motor, inverter and auxiliary losses and idle draw that hydraulic p x q does not), of a different, larger machine, with repeated digging and grading rather than a trench-and-load cycle. A measured hydraulic pressure and flow trace is still needed for H4.
Limits: shape only, two traces from one machine, no circuit energy computed from the trace, model phases are constant-power blocks so "below 10%" is zero by construction.
Next: the parts-cost step (milestone 4), or a hydraulic-pressure trace; rerunning 2d with the demand rescaled to the measured load factor is a cheap sensitivity check.
2026-10-28 · Milestone 2d: do the 2c rankings survive sourced margins? (planned before running)
Sources opened: Briganti, Simulation of an Excavator Hydraulic Circuit, MSc thesis, Politecnico di Torino 2021/22 (supervisor Rundo; https://webthesis.biblio.polito.it/24382/1/tesi.pdf), a simulation of a midi load-sensing excavator: differential pressure limiter 25 bar, local compensator/distributor drop 10 bar, pump 120 cc/rev at 2000 rpm, volumetric 0.92 and hydraulic-mechanical 0.96 efficiency (product 0.883, which matches Juza and Hermanek's measured 0.8834). Williamson's thesis (Purdue) and the RWTH Aachen dig-and-dump paper were fetched but blocked (403 / Cloudflare), so no measured pressure trace yet. The Briganti pressure traces exist only as figures.
Plan: rerun 2c with dp_ls = 25 bar, dp_spool = 6 bar (Juza measured block), eta = 0.883, dp_m still swept (no source), plus a dp_ls sweep to find break-even. --sourced flag on experiments/physics_cycle.py.
Prediction (before running): LS/OC median rises from 0.84 to about 0.95 to 1.0, and the share of cycles with LS > OC from 17% to 30 to 50%.
Ordering OC >= LS >= metered held in only 37.5%; LS/OC median 1.043 (5 to 95%: 0.83 to 1.26), LS worse than OC in 12,503 of 20,000 cycles. The prediction was too mild: LS lost in more than half.
Break-even: with dp_spool = 6 bar the median LS/OC crosses 1 at a margin near 23 bar; at 14 bar it is 0.84 (LS > OC in 6.8%), at 25 bar 1.04 (61%), at 30 bar 1.13. Metered/LS median 0.66, below 0.85 in 100%.
Reading: in a cycle whose phases mostly run at low pressure, a fixed 25 bar load-sensing margin costs more than an open-centre block's 6 bar drop unless the open-centre pump has a large surplus flow. H1 is refuted for these sourced margins; metering's advantage over LS is robust (all cycles).
Limits (important): the margins come from two different machines (a simulated midi excavator and a measured telescopic excavator on a Tatra chassis), and the open-centre model is the pessimistic full-flow bleed, which still wins here; the force-model pressures and phase flows remain assumed (2c); the 25 bar is a simulation set-point, not a measurement. Not an energy figure for any real machine; H4 still needs a measured pressure trace.
Next: obtain a measured pressure trace (a thesis or dataset reachable from this egress; Zenodo/IEEE DataPort/GitHub), then the parts-cost step.
2026-10-28 · Milestone 2c: do load-correlated pressures from a force model change the rankings? (planned before running)
Plan: replace random pressures with a force model (experiments/physics_cycle.py): dig pressure from Reece's cutting-force form against a breakout force, lift from bucket-plus-soil weight on a lever, swing from inertia and friction, six phases, 45 L/min pump, 180 bar relief, 20,000 cycles. Soil gamma/c/N factors, breakout force, lever ratios and masses are assumed typical ranges from memory, not opened sources, so this is a sensitivity test, not an energy figure.
Prediction (before running): ordering holds in over 99%; LS/OC median 0.45 to 0.65 (tied pressures make phases mostly low-pressure, as 2a/2b); Met/LS median 0.75 to 0.9.
Ordering OC >= LS >= metered held in only 83.3% of cycles: prediction failed. Every one of the 3,345 violations has dp_ls > dp_spool (the only way LS can exceed OC in this model), and they sit at slightly higher demand (mean 0.76 of pump flow against 0.70). My reading, not tested: with most phases at low pressure (swing, lower), a 14 to 30 bar load-sensing margin is a large share of the phase pressure, so OC with a 5 to 20 bar spool drop wins when demand is high.
LS/OC median 0.842 (5 to 95%: 0.63 to 1.12), well above the predicted band and above 2a (0.44) and 2b (0.67). Met/LS median 0.697 (0.58 to 0.83), below 0.85 in 98.1%, below the predicted band.
Reading: the earlier headline that load-sensing saves roughly a third to a half of open-centre shaft energy depends on pressures being random and high. When most of the cycle is low-pressure (as a swing-dominated cycle is), load-sensing's saving shrinks to about 16% in the median and reverses in 17% of cycles, while independent metering's saving over LS grows. H1 as a structural claim is refuted for realistic margins; H2 is not tested here.
Limits: every force-model parameter is assumed; the phase structure, speeds (0.4 to 1.0 of pump flow, uniform) and the fraction of relief each phase uses are my choices; no dynamics. H4 still needs a measured pressure trace.
Next: source the pressures (Williamson 2010 or a public excavator pressure dataset) and replace the assumed ranges; until then milestone 2 is not done.
2026-10-28 · Milestone 2b: the rankings on the measured phase times and pump curve of Juza and Hermanek (2023) (planned before running)
Source opened this time (the hosts resolve now; the PDF came through WebFetch): Juza and Hermanek, Research in Agricultural Engineering 69(1):18-27, doi:10.17221/77/2021-RAE, CC BY-NC 4.0. Machine: UDS 214 telescopic excavator on a Tatra 815 chassis, John Deere 4045 94 kW diesel, Bosch Rexroth A8VO107 double pump, 0.63 m3 bucket, a much larger machine than the mini-excavator of milestones 1 to 2a. Measured there and used here: Table 4, the mean cycle of 20 measured cycles in Class II soil: fill 4.01 s, lift 2.21, swing loaded 6.21, dump 4.16, swing back 5.76, lower 2.65 (25.0 s); Table 1, one pump half's measured flow against pressure (158, 156, 153.3, 147, 131.5, 111.7, 77.7, 71.3 L/min at 0, 5, 10, 13, 16, 20, 27, 30 MPa, 1556 to 1600 rpm); Table 2, the open-centre control block's pressure loss 600 kPa (6 bar) and the half-pump's overall efficiency 88.34%.
Not in the paper: per-phase actuator pressures and flows (it measures component losses, not a pressure trace), so those stay random, as in 2a, now on a 300 bar scale (the 30 MPa test pressure). Which actuators work in which phase is my reading of the phase names (fill: 2 or 3 actuators; lift, dump, lower: 1; swings: 1), not sourced.
Plan: 20,000 cycles (5 seeds x 4,000) with the six sourced phase times; open-centre pump flow from the interpolated measured Q(p) at the highest load pressure plus 6 bar (this removes the constant-flow assumption of milestones 1 and 2a); demand per phase uniform 0.2 to 1.0 of Q(p_max) shared among the actuators; pump efficiency 0.8834 fixed; dp_ls 14 to 30, dp_m 3 to 10 swept as before (unsourced). Consistency check on my transcription: Q at 27 MPa must equal the paper's Q1 = 1.295 dm3/s.
Prediction (before running): ordering OC >= LS >= metered in 100%. LS/OC median between 0.40 and 0.65, since OC now delivers less surplus at high pressure but the demand fraction is the same range as in 2a. Metered/LS median between 0.70 and 0.90.
Transcription check passed: Q at 27 MPa is 77.7 L/min = 1.295 dm3/s, the paper's Q1.
Random pressures per actuator (20,000 cycles): load-sensing/open-centre median 0.667 (5 to 95%: 0.48 to 0.86), above my predicted 0.40 to 0.65. Metered/load-sensing median 0.867 (0.78 to 0.93), inside the predicted band; below 0.85 in 36.7% of cycles. Equal pressure within a phase: LS/OC 0.669, metered/LS 0.903 (0.83 to 0.95), below 0.85 in 10.5%.
The ordering is not structural once open-centre uses the measured curve: 99.86% (random) and 99.83% (equal pressure), not 100%, so my prediction failed. The 0.14 to 0.17% of cycles are ones whose demand is close to the whole pump flow at that pressure: load-sensing pays a 14 to 30 bar margin, the open-centre block only the sourced 6 bar, so open-centre wins there. 2a's 100% came from a constant pump flow and an unsourced 5 to 20 bar spool drop.
Reading: with the measured pump curve (flow falls from 158 to 71 L/min as pressure rises) and a measured 6 bar block loss, open-centre wastes less than in the mini-excavator milestones, so load-sensing's saving shrinks from a median 44% (2a) to 33%. The metered-over-LS saving is similar (13% against 28% in 2a under random pressures; 10% against 13% at equal pressure). This is on one large machine's pump and measured cycle times; the pressures and demands are still random, so it is a sensitivity result, not an excavator energy figure.
Limits: the paper reports no pressure trace or per-phase flows, so the headline ratios depend on my random demand (0.2 to 1.0 of pump flow) and on dp_ls and dp_m, which are unsourced; actuators per phase are my reading of the phase names; the 94 kW diesel and two pump halves are not modelled (one half only). Real open-centre spools bleed off less than full flow at partial lever, which this still ignores.
Next: a pressure trace for a measured cycle (H4 still needs one: Williamson 2010's thesis or a public excavator dataset); milestone 2 is closer but not done.
2026-10-28 · Milestone 2a: do the rankings survive a random cycle bounded by a sourced machine envelope? (planned before running)
Why not the measured cycle yet: the two sources that would give one (Juza and Hermanek, Research in Agricultural Engineering 69(1):18-27, 2023, doi:10.17221/77/2021-RAE; Kubota KX018-4 dealer sheet) are on hosts this session cannot resolve (rae.agriculturejournals.cz, kubota.com.au), so the cycle itself stays unsourced. What a search result summary did give, not opened: KX018-4 pump 17.3 x 2 + 10.4 + 6.2 L/min, a 180 bar figure from a parts site (unverified as the relief setting).
Plan: replace the one hand-written cycle with 4,000 random cycles per seed x 5 seeds: 4 phases, 1 to 3 simultaneous actuators, each actuator's flow drawn up to its section capacity (17.3, 17.3, 10.4 L/min), total flow under the 45 L/min pump, pressures uniform on 20 to 180 bar, phase times 2 to 6 s. Margins at the sourced-or-swept values of milestone 1 (dp_ls 14 to 30 bar, dp_spool 5 to 20, dp_m 3 to 10, eta 0.75 to 0.92) drawn uniformly. This tests whether the milestone 1 medians are an artefact of one cycle. It is still not a measured cycle.
Prediction (before running): ordering open-centre >= load-sensing >= metered holds in 100% of cycles (structural). Median LS/OC will fall below milestone 1's 0.47 because open-centre runs at 45 L/min against a mean demand well under that. Metered/LS median between 0.75 and 0.9. H3 check per case: at equal actuator pressures, metered/LS stays under 0.85 in over 95% of cycles.
### Outcome (experiments/envelope.py, seeded, a few seconds; experiments/envelope_results.txt)
20,000 random cycles (5 seeds x 4,000): the ordering open-centre >= load-sensing >= metered held in 100% (structural, as predicted).
Load-sensing/open-centre median 0.442 (5 to 95%: 0.26 to 0.64), per-seed medians 0.440 to 0.444: below milestone 1's 0.47, as predicted; the headline is not an artefact of the one hand-written cycle.
Metered/load-sensing median 0.717 with random per-actuator pressures (5 to 95%: 0.57 to 0.85), outside my predicted 0.75 to 0.9: the wider 20 to 180 bar spread of random pressures gives metering more to remove than the reference cycle. With equal pressure inside each phase the median is 0.873 (predicted range held).
My H3 prediction was framed backwards. I wrote "metered/LS under 0.85 in over 95% of equal-pressure cycles", which is the opposite of H3 (saving under 15%, ratio above 0.85). The result: ratio above 0.85 in 67.7% of equal-pressure cycles, so H3's "under 15% at zero spread" holds per case in about two thirds, and fails in about one third (ratio up to 0.77 at the 5th percentile). H3 as a per-case claim is refuted; as a median claim it held (0.873). The saving at zero spread comes from the margin difference alone (dp_ls 14 to 30 against dp_m 3 to 10 bar) and is largest in low-pressure phases where a fixed margin is a large fraction.
Limits: cycles are random, not measured; the 45 L/min pump, 17.3/17.3/10.4 section flows and 180 bar are from a search-result summary of a Kubota KX018-4 listing and a parts site, neither opened; margins are the milestone 1 ranges. Randomly drawn cycles may be unlike real digging, which is exactly why a measured cycle remains the H4 test.
Next: obtain a measured or physics-derived cycle (needs rae.agriculturejournals.cz and a manufacturer sheet host allowed, or a dataset via add_repo); until then milestone 2 is not done.
2026-10-28 · Milestone 1: do the three circuits order the way theory says, and by how much? (planned before running)
Hypotheses and plan: see PROPOSAL H1 to H3. Grid: flow demand 3 x pressure spread 4 x pump flow 3 x dp_ls 3 x dp_spool 3 x dp_m 3 x pump efficiency 3 = 2,916 cases on one illustrative four-phase cycle (pressures and flows written from memory, not sourced).
Prediction (before running): open-centre > load-sensing > metered in 100% of cases (this follows from the model's structure, so it is a check of the code, not a finding); load-sensing/open-centre falls as demand falls; metered/load-sensing falls as spread rises; at zero spread metered/LS is above 0.85.
### Outcome (experiments/run.py, under 5 s; experiments/results.txt; 6 tests pass)
All three orderings held in 2,916 of 2,916 cases. Because each rung only removes a loss term from the one before it, this is a structural fact, not evidence about real machines.
Median load-sensing/open-centre shaft energy 0.47 (0.22 to 0.81); by demand 0.31, 0.47, 0.63 for 0.5, 0.75 and 1.0 of the cycle flow: H2's direction held.
Median metered/load-sensing 0.80 (0.68 to 0.97); by spread 0.88, 0.82, 0.78, 0.74 for 0, 0.5, 1, 1.5. At zero spread the median is 0.88 (prediction above 0.85 held), still a 12% saving from the smaller margin alone; H3's "under 15% at zero spread" held on medians, but no per-case check was made.
Limits: the cycle is illustrative; no dynamics, no line losses, no leakage, no energy recovery; open-centre modelled as full pump flow at the highest load pressure, which is the pessimistic end (real open-centre bleed-off spools do better at partial lever); efficiency is one constant. These numbers say nothing yet about a real machine; H4 is the test.
Next: a sourced duty cycle (milestone 2). Crossref was unreachable; key citations were confirmed by web search (HEAP is in Automation in Construction, not Science Robotics as the track text says). Williamson (2010) reports measured fuel cuts of a pump-controlled 5 t excavator: the H4 anchor.
Which body carries a survey payload furthest per kWh? Hull choice for small autonomous boatsResearch programme (proposal stage): energy per survey kilometre of hull types for 100 to 500 kg autonomous boats; with a Michell wave term a catamaran out-ranges a monohull in 3.3% of 6,561 cases, none at equal length; with Slocum coefficients from the gliderflight package a glider never out-ranges a same-mass propeller AUV at equal hotel load (0 of 2,430 cases); it breaks even when the AUV's hotel load is about 5 times its own; a REMUS-100-class AUV's non-propulsion load implied by vendor endurance is 104 to 175 W, far above that, so the glider out-ranges it in every case on energy per metre (at a tenth of the speed); a Savitsky planing hull reaches at most 0.14 of the monohull range (0 of 48 cases); a SWATH (two submerged torpedoes on struts) out-ranges the monohull in none of 4,374 swept pairs; charging panel mass to the battery (2 to 10 kg/m2, swept) cuts the median solar range multiplier from 2.01 to 1.64 at worst, and the full deck stays the best array wherever range is finite; against ten years of daily NASA POWER insolation a threshold speed policy (slow or hold when the pack is under 30%) never raises km/day over a fixed 1 m/s but cuts pack-empty days, e.g. 25.4% to 1.5% for a 4 m boat at 25 N
Holding a survey line in current and waves: line-of-sight against integral line-of-sight for a small boatPlain line-of-sight guidance leaves a steady cross-track offset of delta*tan(asin(c/U)) in a cross current c (simulation matches it to 1%: 3.77 m at 0.3 m/s, 12 m look-ahead); integral LOS removes it, with lower rms cross-track error in 136 of 144 cross-current cases and the 8 exceptions all at a 6 m look-ahead with integral gain 2, where it oscillates (rms about 2.3 m even in still water)
Produced with AI assistance (Claude). Results are from the code in this repository and are simulated or stylised unless the abstract says otherwise; nothing here implies affiliation with or endorsement by any lab, researcher or company cited. MIT licensed.