How long do regimes, states and empires last, and does the risk of collapse rise or fall with age?
research/civ-patterns
How long do regimes, states and empires last? On Polity5 (1,387 regimes since 1800) and Seshat's Cliopatria (1,543 polities since 3400 BCE), regimes age out of risk (democracies to 0.5% a year after 40 years, anocracies stay near 5%), big empires fit a constant hazard (Arbesman 2011), and a backtested duration model forecasts 10-year regime change with AUC 0.69; applied to 2018's regimes and 2024's states
11 tests
What it found
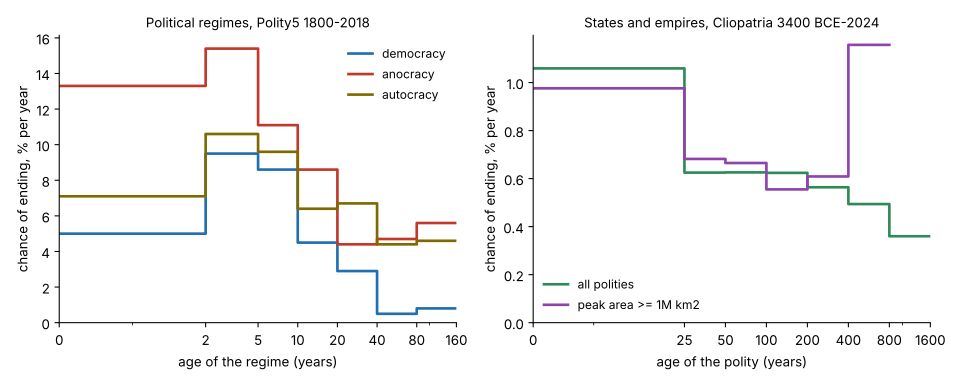
Survival analysis of 1,387 Polity5 regime spells (1800–2018) and 1,543 named states and empires in Seshat’s Cliopatria (3400 BCE–2024, CC BY). Regimes age out of risk: the yearly chance a spell ends peaks at 12% in years 2–5 and falls to 2% after age 80; for democracies to 0.5% after age 40, while anocracies and autocracies level off near 5%. Anocracies end 1.9× as fast as democracies (95% CI 1.6–2.2), replicating Gates et al. (2006). Fitted only on data before each cutoff (1966–2006), a piecewise hazard by type and age forecasts which regimes end within 10 years with AUC 0.69 over 696 forecasts and beats a constant-hazard baseline on Brier score (0.222 against 0.252), though every model forecast fewer endings than happened.
For empires that ever held a million km² the Weibull shape is 0.91 (CI 0.82–1.02), consistent with Arbesman’s (2011) memoryless lifetimes; across all polities there is high early risk (1.1%/year in the first 25 years) then about 46% a century, and starting bigger does not help (hazard ratio 1.06 per tenfold area). Over a century, age barely predicts which states survive (within-cutoff AUC 0.46–0.61): the turnover rate of the era (35% a century after 1600, 79% after 1900) dominates.
Applied to today: 41% of 2018 regimes expected to end by 2028 (young anocracies about 70%, long-standing full democracies 5–7%), and about half of today’s mapped states expected to persist under the same name to 2124, within a backtest range of 0.2–0.65. A Polity “regime end” is any 3-point change, not a collapse; the models use only type and age, so the probabilities are base rates, not judgements about any country.
A figure from its own output
civ-patterns/experiments/hazard_by_age.svg, written by the project's own experiment code.
Research log
Ongoing: each run adds a batch and an entry, newest first. Source: LOG.md.
2026-11-01 · Outcome: regimes age out of risk; big empires are memoryless; era beats age over a century
H1 held (Gates et al. 2006): Kaplan-Meier median 4.8 years for anocracies, 8.9 for democracies and 7.3 for autocracies; Weibull hazard ratio against democracy 1.89 (1.63 to 2.19) for anocracies and 1.45 (1.23 to 1.69) for autocracies.
H2 held for democracies and anocracies, not for autocracies: k = 0.81 (0.74 to 0.88) and 0.86 (0.81 to 0.91), but 0.95 (0.88 to 1.02) for autocracies. The piecewise hazard shows why: democracies fall to 0.5% a year after age 40, while anocracies and autocracies plateau near 4.5 to 5.5%. The risk is not monotone either. It peaks in years 2 to 5 (12%), not in year 0 to 2 (9%).
H3 held: Weibull+type beat the exponential by 0.015 Brier (95% bootstrap 0.007 to 0.022, n = 696, units repeat across cutoffs). Unplanned addition, logged here as such: a piecewise hazard by type was better still. Fitted on the 40 years before each cutoff, it beat Weibull+type by 0.015 (0.005 to 0.026) and was the best calibrated, but its log loss was worse (0.696 against 0.668) because empty cells give near-zero rates. All models under-forecast endings after 1960 by about 10 points.
H4 refuted for all polities, held for big empires: k = 0.83 (0.80 to 0.87) overall; for the 224 that ever reached a million km², k = 0.91 (0.82 to 1.02), and the AIC barely prefers Weibull (0.8). Most of the overall ageing is early mortality: 1.1% a year before age 25, then about 0.6% a year to age 400. Big empires' mean observed life is 123 years against Arbesman's 220. That is a different sample and definition: Cliopatria splits a dynasty when its name changes.
H5 refuted: the hazard ratio per tenfold initial area is 1.06 (1.00 to 1.13), and the largest-start quartile has the shortest median (69 years). Large starts are often modern colonial or wartime entities.
H6: medians are 350 years (Bronze Age, n = 26, 100-year snapshots), 153 (1000 BCE to 0), 98 to 117 (0 to 1800) and 46 (polities begun after 1800, 433 of them).
Backtest of 100-year state survival (cutoffs 1600 to 1900): base rates swing from 0.35 to 0.79, and age-based models score AUC 0.46 to 0.61 within a cutoff and lose to the constant hazard on pooled Brier (+0.006, 0.003 to 0.009). Over a century the era, not the age, is the information.
Not done: covariates beyond type and age; scoring the 2018 forecasts against 2019 to 2024 events (V-Dem ERT); a calendar-time hazard for Cliopatria.
2026-11-01 · Plan: regime and polity lifespans on real data (written before the runs)
Data: Polity5 regime spells, 1800 to 2018 (Marshall and Gurr 2020, p5v2018d.xls, downloaded at run time, not redistributed), and Seshat's Cliopatria v0.2.1 (Chalstrey et al. 2025, CC BY 4.0, 1,587 named polities from 3400 BCE to 2024 CE).
Regimes. H1 (Gates et al. 2006): anocracies (Polity -5 to 5) have the shortest median duration; democracies and autocracies last longer. Refuted if the anocracy Kaplan-Meier median is not below both. H2: a regime's yearly risk of ending falls with its age (Weibull shape k < 1 with the 95% interval below 1). Refuted if the interval contains 1 or k > 1. H3: a Weibull model with regime type beats a constant-hazard baseline at forecasting which regimes end within 10 years, out of sample at cutoffs 1966, 1976, 1986, 1996 and 2006 (pooled Brier difference, bootstrap interval below 0). Refuted otherwise.
Polities. H4 (Arbesman 2011, on Taagepera's 41 empires): lifespans are close to exponential, a constant hazard with no ageing. Refuted if the Weibull k interval excludes 1. H5: polities that start larger last longer (hazard ratio per tenfold initial area below 1, interval excluding 1). Initial area, not peak area, so a long life cannot cause a big number. H6 (exploratory, no direction): the median lifespan differs across the era a polity started in.
Analysis: censoring at the end of each dataset; spells or polities already running at the start of a dataset (1800 for Polity, 3400 BCE for Cliopatria) are dropped because their age is unknown. Cliopatria's snapshots are coarse before about 1500 CE, so durations are measured to the snapshot spacing; I report the spacing by era and check the main fits on post-1500 polities. Nothing here is a forecast about a named country's politics beyond what a duration model fitted to its history says; the write-ups will say so.
Does adoption spread through village networks as a simple or a complex contagion, and whom should a rollout seed?Research programme: does adoption spread through real village networks as a simple or a complex contagion, and whom should a rollout seed? On the 43 Banerjee et al. (2013) microfinance villages, the data cannot reliably tell the models apart, but the seeding advice survives that and the uncertainty in the fits: degree discount, which needs the network but no model, loses a median 1.0% of adopters (at most 1.6% in 95% of refitted bootstrap draws) under every fitted model, greedy seeding 0.5%, a 25% household survey about 5% (a two-stage survey of half the households, ranked by degree discount on the ties seen, 1.6% at the point fits, a median 1.9% over refitted fits, and 1.8% for its three-quarters-random split when respondents forget the 16% of ties measured in the same survey, 2.2% when, as measured, they forget weak ties four times as often as strong ones, 1.8 to 2.4% for any recall from 70% to 90%, and 2.2 to 2.7% when respondents also name one false tie per four true ones; keeping only ties both ends name helps a census, not a half survey, and stops helping once about half of false ties are named by both ends), the lender's leaders 6 to 10%, and clustering seeds together does not help; complex centrality, the measure built for complex contagions, loses up to 3.7% (a median 3.3% over refitted fits; it helps more the higher the fitted threshold, but never matches degree discount), and seeding whole neighbourhoods 10 to 13%.
Which interventions bring a polarized society back together, and does contact backfire?Which interventions bring a polarized society back together? In an opinion-dynamics model with backfire swept from none to strong, bridging ties across camps never merges them and at a rejection threshold of 0.7 rewiring 10% of ties drives everyone to the extremes, while a ladder of committed voices within reach merges them in 24 of 25 settings (moderate broadcast 19, nudge 14, tolerance 8, bridging 2)…
Produced with AI assistance (Claude). Results are from the code in this repository and are simulated or stylised unless the abstract says otherwise; nothing here implies affiliation with or endorsement by any lab, researcher or company cited. MIT licensed.