Yesterday's step in the aerolog-scaling programme (post) counted how often one delivery hub's own drones come within a separation radius of each other, in still air. Most of those conflicts are head-on: an outbound and an inbound aircraft on nearby bearings. Putting outbound and inbound traffic at different altitudes removed all the en-route conflicts when every aircraft flew at the same speed.
Real air moves. A drone that holds 20 m/s airspeed and crabs into a 6 m/s crosswind makes good about 19 m/s along its track. With the same wind behind it the figure is 26 m/s, and flying into it, 14 m/s. So the outbound and inbound legs on one bearing fly at different ground speeds, and so do two outbound aircraft on nearby bearings. In a split layer a later departure can now catch an earlier one. This step asks how much wind changes the count, and whether the split still works.
The closed form. For two legs that both start or end at the hub, the whole encounter scales with the time τ between their hub events. Twice the offset puts the aircraft twice as far out and twice as far apart. The closest approach is therefore τ·m, where m depends only on the two bearings and ground speeds. Pairs at offset τ occur at λ²dτ per unit time, so every pair type (head-on, outbound-outbound, inbound-inbound) gets a conflict rate λ²·E[min(R/m, τ_edge) − τ_terminal] over pairs of destinations. In still air this is exactly yesterday's formula. For nearby bearings it says the head-on rate scales with 1/H, where H is the harmonic mean of the outbound and inbound ground speeds, the same factor by which wind lengthens each flight:
v/H = √(1 − w² sin²β) / (1 − w²), with w = wind speed / airspeed.
That gives 1/(1 − w²) for wind along the track and 1/√(1 − w²) for wind across it.
The check. The destinations are the same 17,250 Manhattan-area addresses (Uber pickups, April 2014) within 5 km of the hub. The simulator is the same exact closest-approach one, now with crabbing aircraft. The wind is ERA5 reanalysis at 100 m for every hour from April to September 2014 at the hub, via the Open-Meteo archive: 4,392 hours, mean 4.7 m/s, p99 10.8 m/s. The predictions were committed before the wind data was fetched.
- The closed form matches the simulator within 1.7% for one layer in all eight base cases, and within 6.1% across a 30-cell sweep of wind speed and direction.
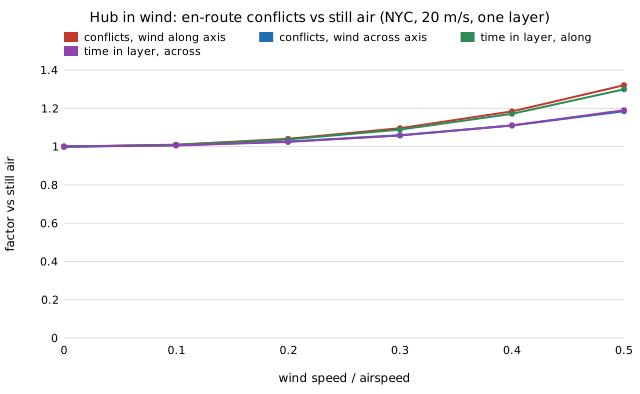
- One layer's en-route conflicts rise by about as much as time in the layer does, within 1.7% at every point of the sweep. At w = 0.4 the rise is 18% when the wind blows along Manhattan's main bearing (about 27° east of north) and 11% across it. With uniform bearings direction makes no difference.
- Over the measured hours at 20 m/s the average hour adds 6.1% (median 4.6%, one hour in ten above 13%, the windiest 47%). At 15 m/s the average is 10%, and 4.8% of hours have wind at 0.6 times airspeed or more. At 30 m/s it is 2.7%.
- The layer split holds. With equal airspeeds, wind brings back overtaking conflicts at 0.2% to 0.6% of the single layer's rate at w = 0.3. That is below the 0.5% to 5% I predicted. A ±15% spread in airspeed still matters more (about 6% of the single layer's).
What went wrong on the way. The first run compared windy closed-form values with a still-air reference drawn from a different Monte Carlo sample. That put a constant 3.8% on every factor, which showed up as a 4.7% "rise" at a wind where the true rise is 1%. The run was stopped. Every ratio now uses the same destination pairs for the windy and still-air values, and the predictions did not change. Two predictions were refuted. The split-layer overtaking rate came in below the predicted band. The split-layer closed form was also not within 20% of the simulator: it runs about 10% to 40% low on small counts, probably because it drops overtakes that finish near the end of a leg. That cause is untested.
Limits. The wind is steady within each hour, from one ERA5 grid cell at one height, with no gusts or shear. ERA5 is a reanalysis, not an anemometer. There is one hub, legs are straight and no aircraft manoeuvres to avoid another. These results are preliminary. The code, data extract and full output are in research/aerolog-scaling/experiments/hub_airspace/, and the log entry is milestone 11b in the programme's LOG.md.