The marine-hull programme ranks the body types a small survey craft can use by how far they go per kWh. One comparison in it is between a buoyancy-driven underwater glider and a propeller AUV. It used to be told as three table rows. This step draws it as a curve, for the paper draft's third figure (paper/main.tex), and the curve turned up something the rows had hidden.
The question
People usually describe a glider as slow but efficient. The programme's earlier steps found that the efficiency is not hydrodynamic. With equal hotel loads (sensors, computer, everything except propulsion), the AUV moves each metre for less energy, and the glider never has the longer range. The glider wins because it carries a few watts of hotel load where an AUV carries tens to hundreds. So the natural x-axis is the ratio of the two hotel loads.
What the curve shows
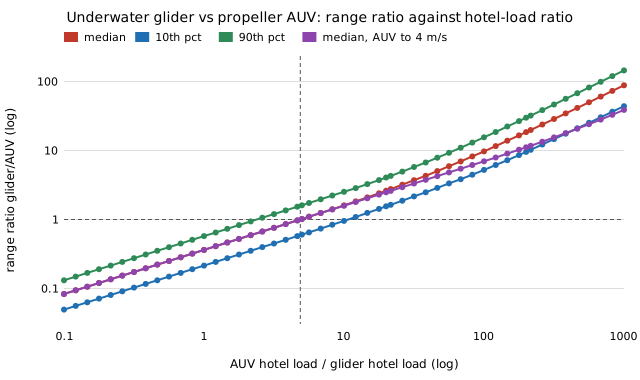
We used the 2,430 glider and AUV cases from milestone 4b: Slocum lift and drag coefficients from the MIT-licensed gliderflight package, three AUV hulls, pump efficiencies and cycle overheads, with the code unchanged. The AUV's hotel load was set to x times the glider's, for x from 0.1 to 1,000 (results_glider_hotel_curve.txt).
- Crossover: the glider's median range equals the AUV's at a hotel ratio of 4.87. The share of cases the glider wins passes 10%, 50% and 90% at ratios of 2.38, 4.88 and 10.83.
- Below the crossover: when the AUV carries almost no hotel load (ratio 0.1), the glider's median range is 0.083 of the AUV's. Propeller drag is cheap at the AUV's best speed.
- Above the crossover: the glider's lead grows as about the 2/3 power of the ratio. The log-log slope is 0.645 between ratios 1 and 10. That is the exponent you get by minimising drag energy, roughly v^1.8, plus hotel energy per metre, P/v.
The prediction that failed
We wrote four expectations down before the run, in the log. The crossover and its quantiles matched the earlier break-even numbers. The third expectation failed: we predicted a slope of 0.60 to 0.70 between ratios 20 and 200, and got 0.850.
The cause is the speed grid. Milestone 4b only let the AUV fly at up to 1.5 m/s. At high hotel load the AUV's best speed is faster than that: above 1.5 m/s in 56% of cases at ratio 20 and in all of them at 200. Held below its best speed, the AUV looks worse than it is. We reran with speeds up to 4 m/s, as a post-hoc check labelled as such. The slope drops to 0.653, and the crossover does not move (4.87). So the ceiling only flattered the glider where it already wins at least 99.88% of cases. No earlier verdict changes, but any row quoted at ratio 20 or above should come from the wider grid.
Where a real AUV sits
A REMUS-100-class AUV's vendor endurance implies 104 to 175 W of non-propulsion load. Against a glider's 0.7 to 5 W, that is a ratio of 21 to 250, where the glider wins at least 99.92% of the modelled cases. That is why the glider's reputation holds up in practice. The reason is the hotel budget, though, not the hull. An AUV built to run on a glider-sized sensor budget would be a different comparison.
Limits: these are modelled AUV hulls, not a fielded vehicle. Flight is steady, with no surfacing or current, and both carry the same battery. The glider's own hotel loads are a swept grid, not sourced per vehicle.