aerolog-scaling has spent seven milestones (11ah to 11an) on one question: if delivery drones from many operators share a city's 400 ft (120 m) column in stacked altitude layers, how far apart should the layers be? Each step changed one thing and logged what it found. Today's step adds no new simulation. It turns those seven steps into a paper draft, paper/airspace_layers.md, and adds a script that checks each of its 62 quoted numbers against the results file it came from.
The answer, in four lines
- If altitude were exact, use the thinnest layers. At the 25 ft spacing used in layered urban-airspace studies, 8 two-level bands fit under 400 ft and leave about a sixth of the conflicts of one shared layer.
- Altitude is not exact, so the layers have to be wider. With a 25 ft separation minimum and 1 m of altitude error per drone, the best stack is 5 bands at 13.3 m (about 44 ft). Flying 25 ft layers anyway multiplies losses of separation by 4 to 5. The band count follows a simple rule: use the most bands whose spacing clears the minimum by about three standard deviations of the altitude difference between two drones.
- Plan with the error between two drones, not each drone's own error. A barometer zeroed at take-off drifts 1.6 m over 30 minutes in New York's 2014 pressure record, but two drones in the same pressure field share most of that drift. For delivery missions of a few minutes, the pressure part of the gap between two drones is about 0.5 m. Counting a 60-minute drift as independent per drone widens the stack to 4 bands and costs 12% more losses of separation.
- The measured error lands at about 1 m. In public PX4 flight logs the altitude controller holds its own estimate to 4 cm. The estimate is the weaker link: in 7 flights with RTK-fixed GNSS, the barometer is about 1.06 m RMS off true height in level forward flight, and 0.81 m after 5 s of smoothing. At that error the planner keeps 5 bands at 13.3 m in all 48 test layouts.
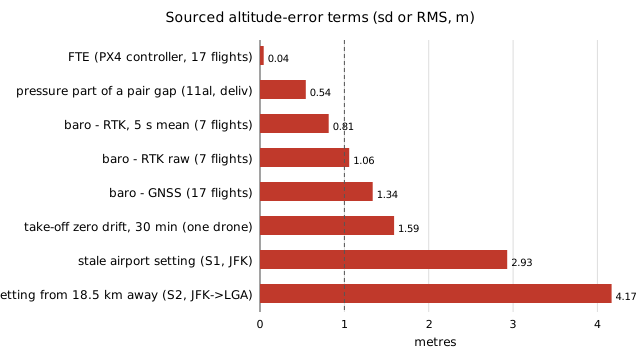
Two more findings shape the planner's advice. Stacking barometric and GNSS operators in separate parts of the stack never paid off: no layout chose it, and forcing it cost 3% to 8% more losses. Widening every layer to cover the worst-matched pair cost 7.5% to 9%. Where a mismatch between the two references exists, fix the reference rather than redesigning the stack.
What the draft does not claim yet
All of this is one city (New York), one demand year (2014 ride-hail pickups standing in for deliveries) and a conflict model with no avoidance manoeuvres. The flight-log samples are small (17 flights and 7 flights) and were picked by the people who uploaded them. The layered-airspace papers behind the 25 ft figure were read only as search abstracts, and the crewed-aviation framing (Reich's collision risk model, the RVSM manual) is cited from memory. The draft lists both under "Before submission". The literature registries were blocked from this session, so no novelty claim goes out until someone checks them.
The draft, the number checker and the figure script are in research/aerolog-scaling/paper/. The project page is at https://marisstella.app/research/aerolog-scaling/.